Free Access
Fig. 5.
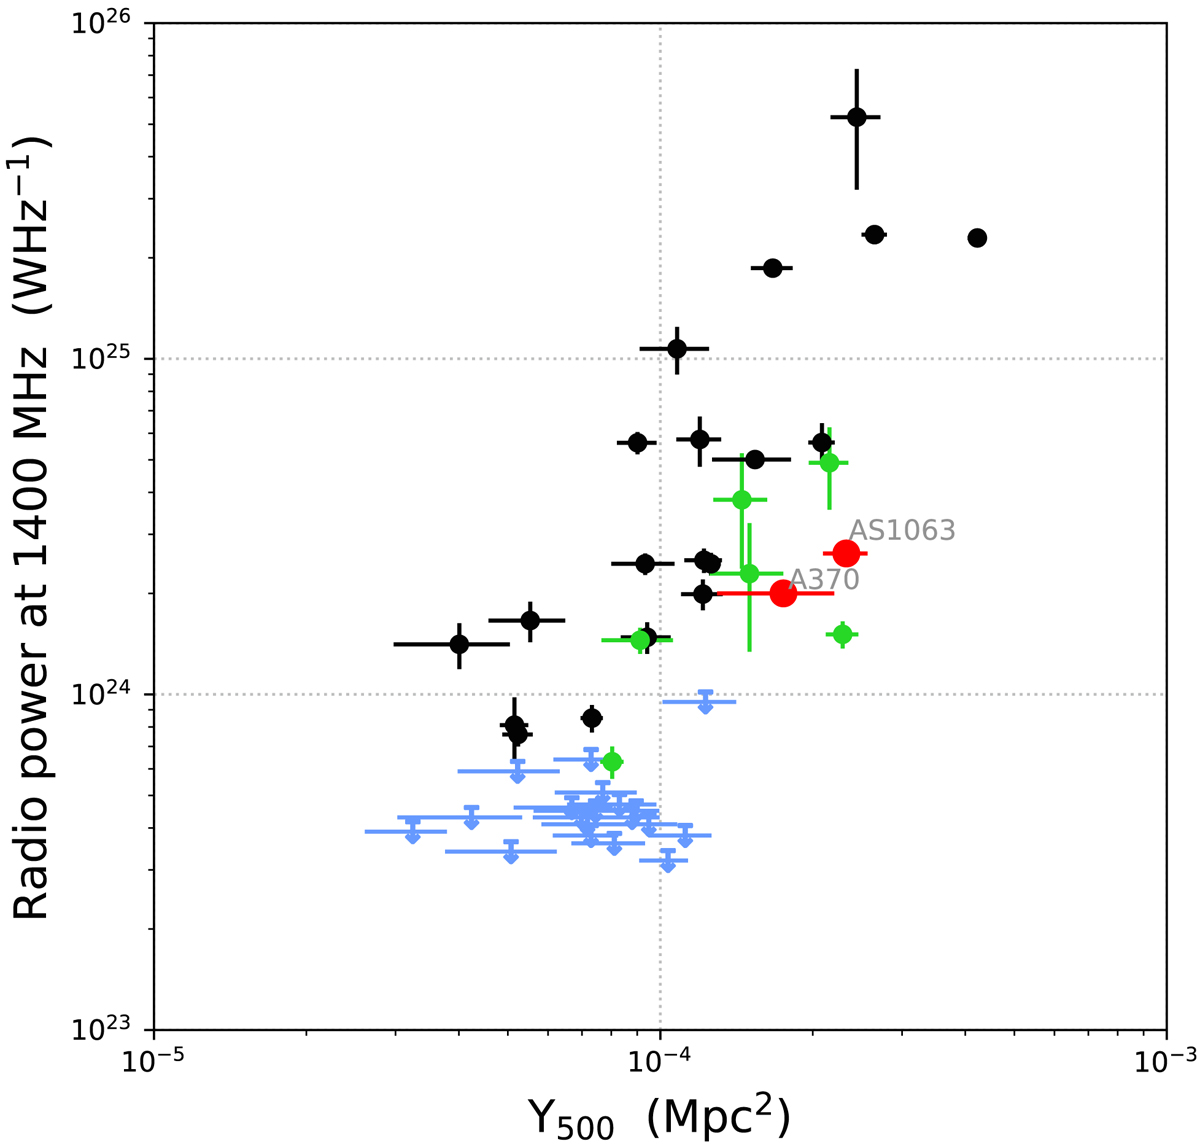
Distribution of radio halos in the P1.4 GHz − Y500 diagram. Different symbols are used to represent the radio halos (black dots), radio halos with ultra-steep spectra (green dots) and the upper limits (blue arrows) from Cassano et al. (2013). AS1063 and A370 are shown as red dots.
Current usage metrics show cumulative count of Article Views (full-text article views including HTML views, PDF and ePub downloads, according to the available data) and Abstracts Views on Vision4Press platform.
Data correspond to usage on the plateform after 2015. The current usage metrics is available 48-96 hours after online publication and is updated daily on week days.
Initial download of the metrics may take a while.