Fig. 2.
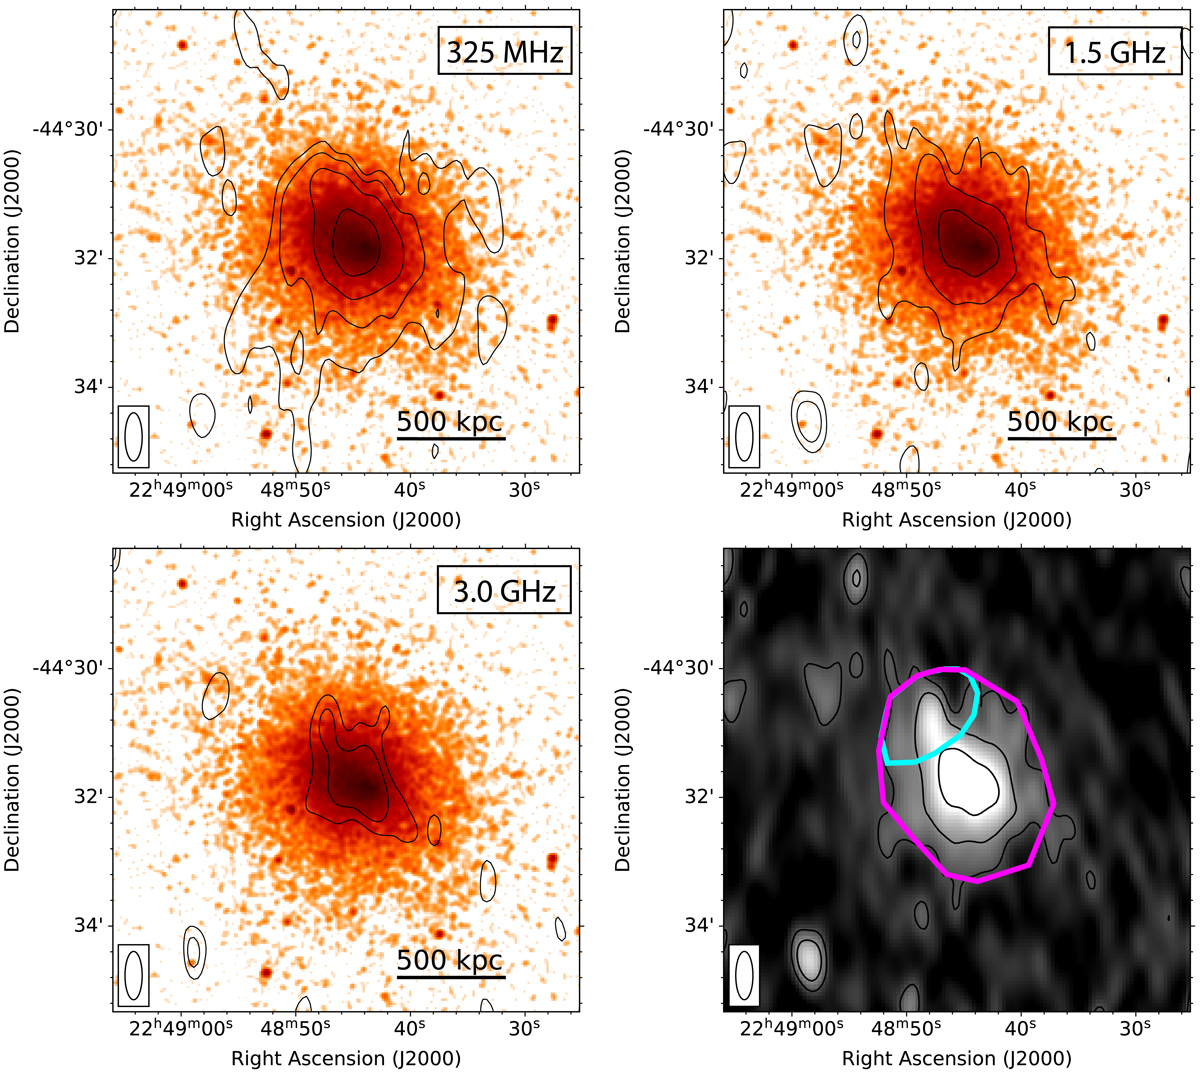
Chandra image of AS1063 overlaid with the radio contours of diffuse emission in AS1063 at three frequencies (325 MHz, top left; 1.5 GHz, top right; 3.0 GHz, bottom left). Chandra images are all in the energy band 0.5–2.0 keV with pixel size 4 × 0.492″ and smoothed with a Gaussian with scale of 3 pixels across. Contour levels are drawn at [1, 2, 4, 8,...] × 3σrms, where σ325 MHz = 96 μJy beam−1, σ1.5 GHz = 40 μJy beam−1, σ3.0 GHz = 24 μJy beam−1. Compact radio sources were subtracted in all radio images. The inner uv-cut of 0.15 kλ is adopted for all radio images. Bottom right: VLA L-band image of AS1063 depicting the region where we extract the integrated flux densities. The cyan polygon indicates the region where the diffuse AGN component is subtracted from the total flux measurement (magenta polygon).
Current usage metrics show cumulative count of Article Views (full-text article views including HTML views, PDF and ePub downloads, according to the available data) and Abstracts Views on Vision4Press platform.
Data correspond to usage on the plateform after 2015. The current usage metrics is available 48-96 hours after online publication and is updated daily on week days.
Initial download of the metrics may take a while.