Fig. 11.
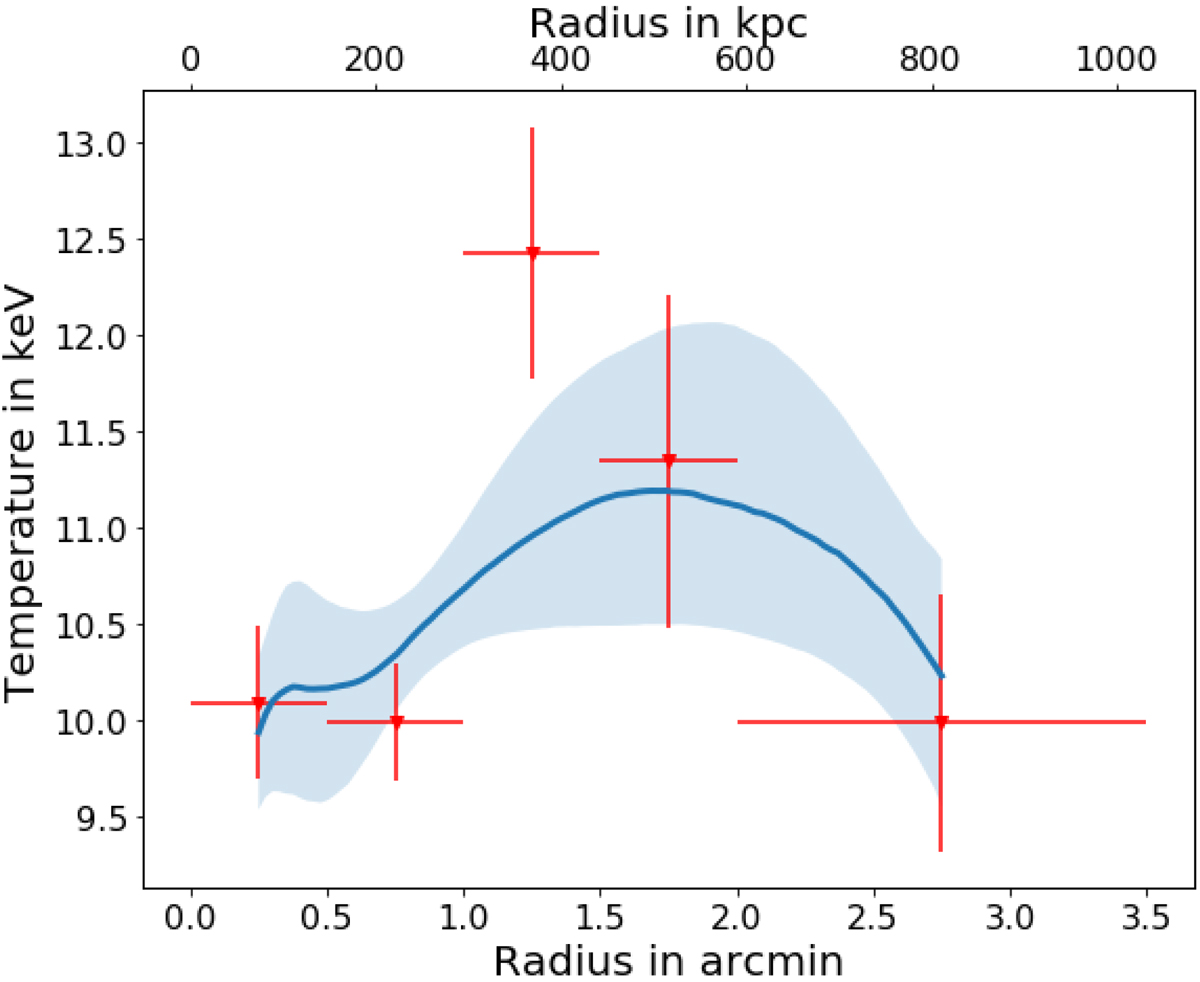
Radial temperature profile of AS1063 obtained from XMM-Newton observations (Lovisari et al. in prep.). The size of the bins was set to be ≥30″to limit the scatter of photons from bin to bin. The observed projected temperatures are shown by red points. The blue line and shaded area show the best-fit projected profile and its 1σ uncertainty computed by using the best-fit three-dimensional model described in Vikhlinin et al. (2006).
Current usage metrics show cumulative count of Article Views (full-text article views including HTML views, PDF and ePub downloads, according to the available data) and Abstracts Views on Vision4Press platform.
Data correspond to usage on the plateform after 2015. The current usage metrics is available 48-96 hours after online publication and is updated daily on week days.
Initial download of the metrics may take a while.