Free Access
Fig. 4.
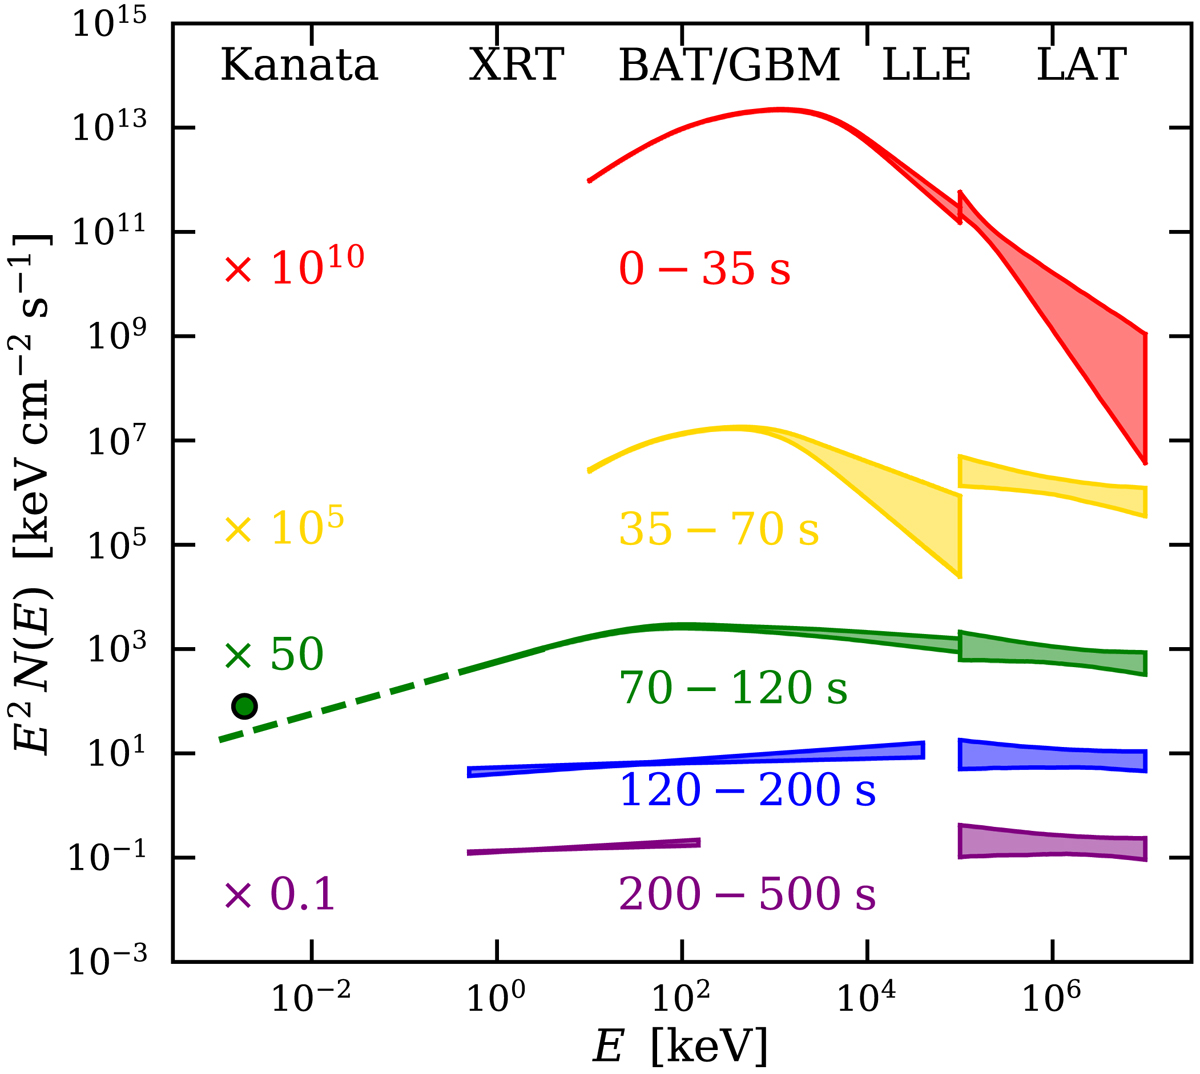
Evolution of the SED of GRB 180720B. Each curve corresponds to a specific time interval and has been rescaled for presentation purposes by the scaling factor reported in the figure. For reference, the top labels denote the instruments providing data in the corresponding energy ranges.
Current usage metrics show cumulative count of Article Views (full-text article views including HTML views, PDF and ePub downloads, according to the available data) and Abstracts Views on Vision4Press platform.
Data correspond to usage on the plateform after 2015. The current usage metrics is available 48-96 hours after online publication and is updated daily on week days.
Initial download of the metrics may take a while.