Fig. 3.
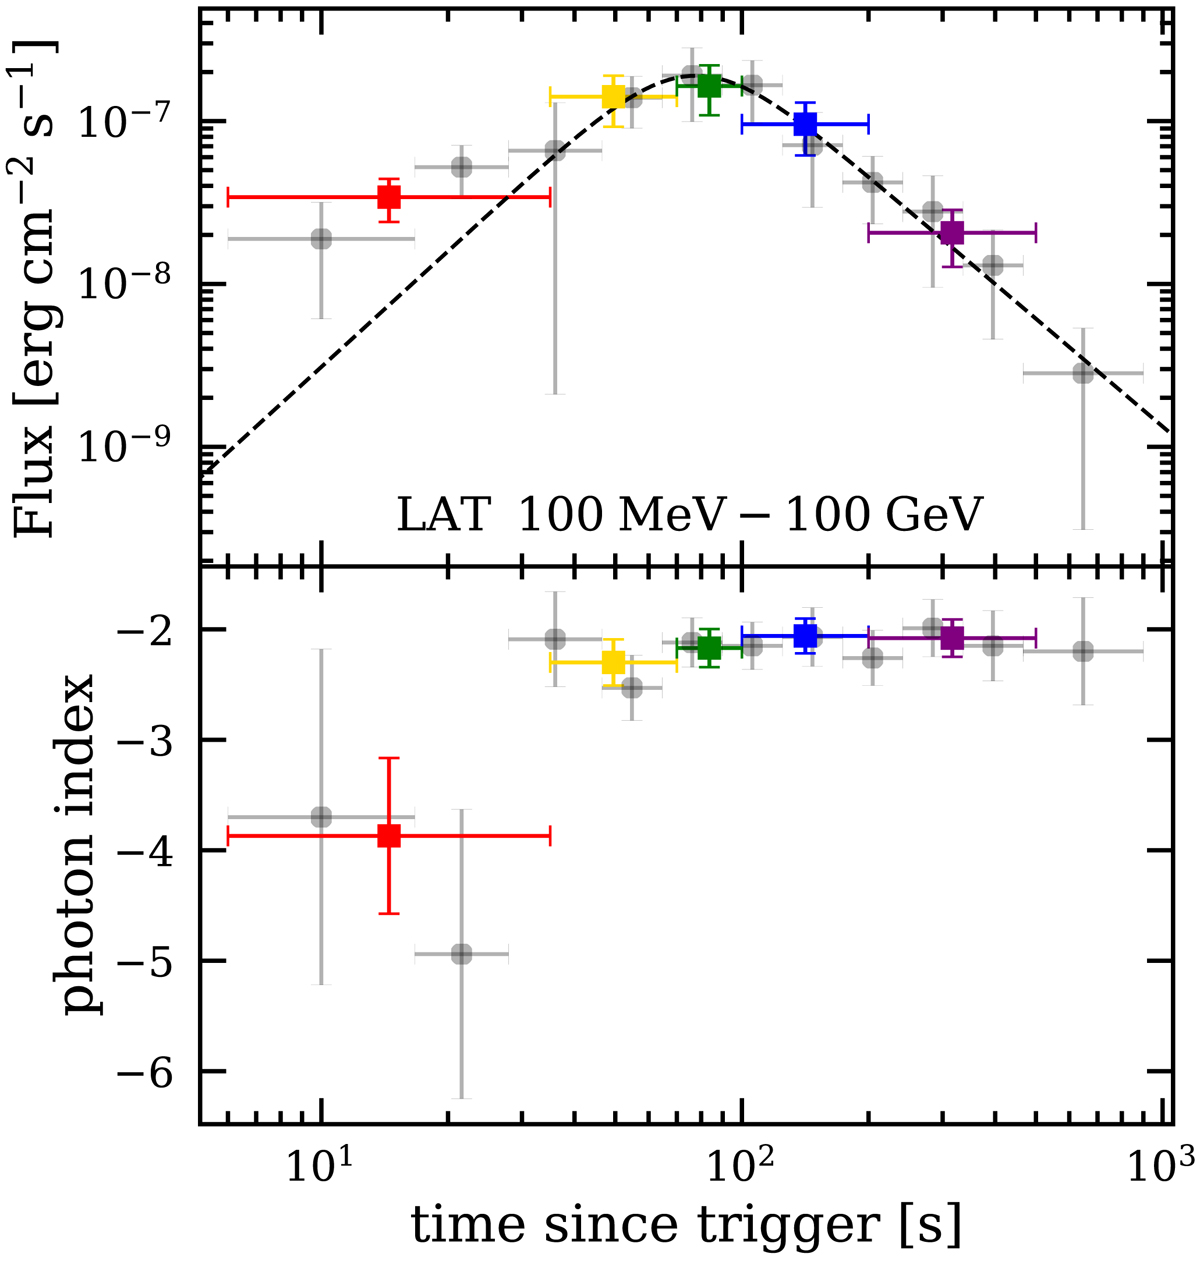
Top panel: LAT light curve. The energy flux is integrated over the 100 MeV–100 GeV energy range. Coloured square symbols correspond to the time intervals defined in 1; grey circles show the results of the analysis with a higher time resolution. Bottom panel: photon indices of the power-law model used for the LAT data analysis. Same colour coding and symbols as the top panel.
Current usage metrics show cumulative count of Article Views (full-text article views including HTML views, PDF and ePub downloads, according to the available data) and Abstracts Views on Vision4Press platform.
Data correspond to usage on the plateform after 2015. The current usage metrics is available 48-96 hours after online publication and is updated daily on week days.
Initial download of the metrics may take a while.