Free Access
Fig. C.1.
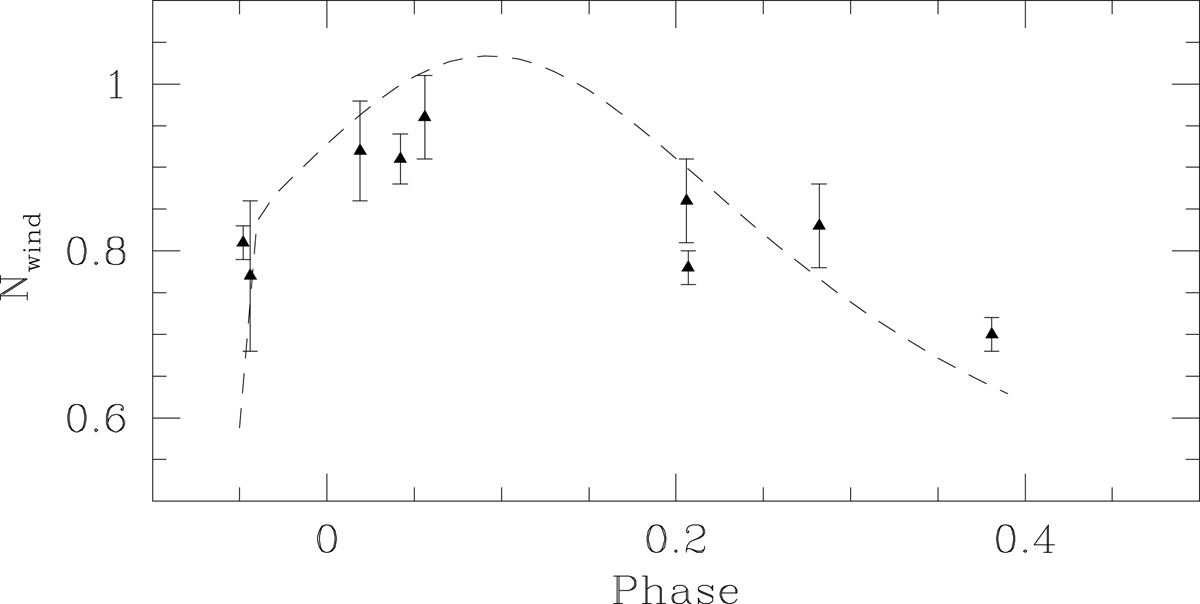
Variations in the column density in 1022 cm−2 obtained in the fits to the XMM-Newton spectra (triangular symbols with error bars) fitted with the model of Williams et al. (1990) for i = 20° (dashed line).
Current usage metrics show cumulative count of Article Views (full-text article views including HTML views, PDF and ePub downloads, according to the available data) and Abstracts Views on Vision4Press platform.
Data correspond to usage on the plateform after 2015. The current usage metrics is available 48-96 hours after online publication and is updated daily on week days.
Initial download of the metrics may take a while.