Free Access
Fig. 6.
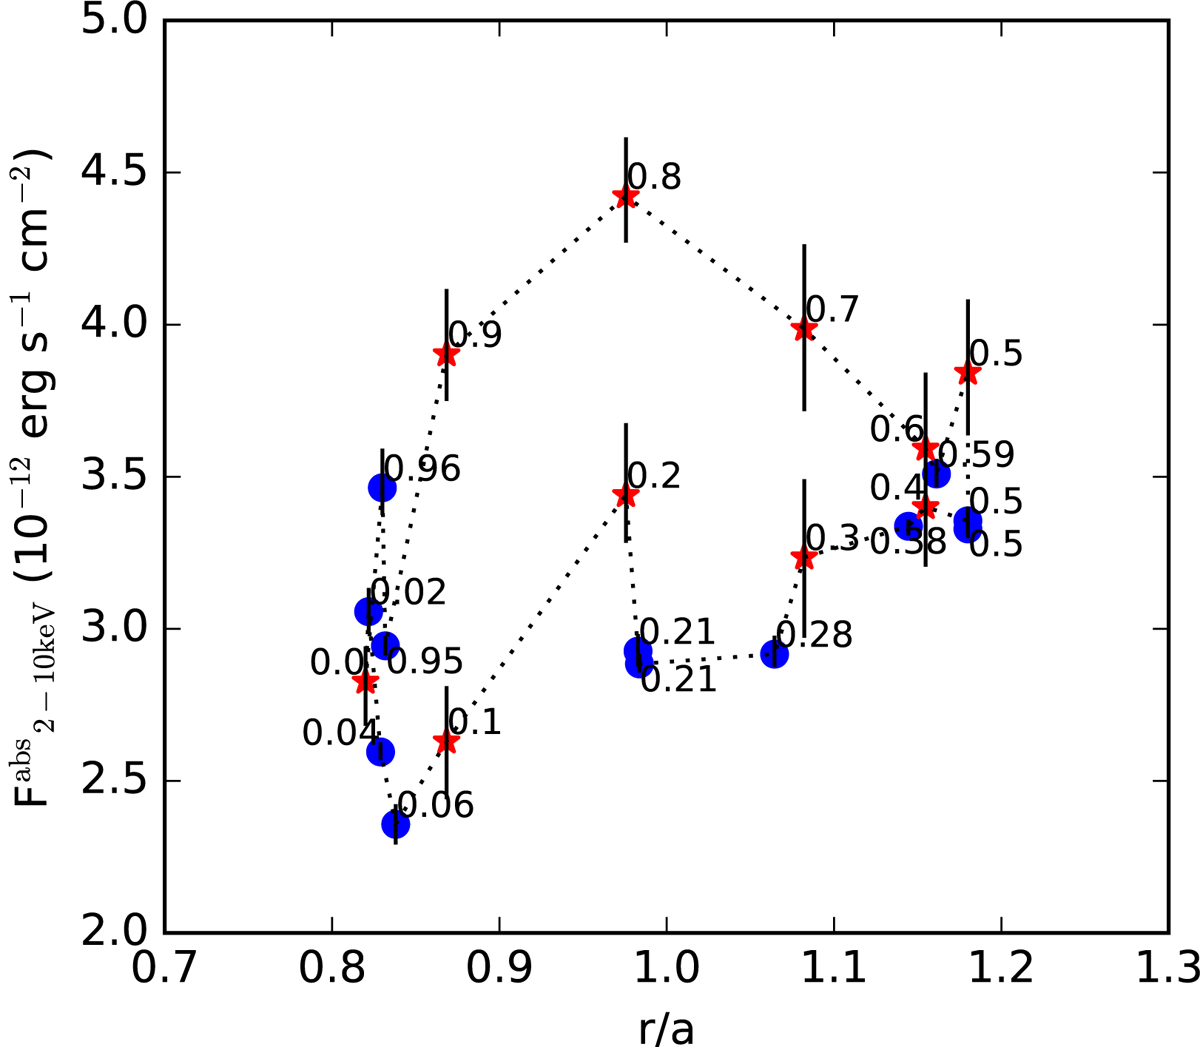
Observed X-ray flux of Cyg OB2 #8A in the 2−10 keV energy bands as a function of orbital separation computed with the revised orbital solution (see Table 2). Blue filled circles correspond to XMM-Newton spectra, whilst red asterisks stand for Swift observations binned in orbital phase (0.1 phase bins).
Current usage metrics show cumulative count of Article Views (full-text article views including HTML views, PDF and ePub downloads, according to the available data) and Abstracts Views on Vision4Press platform.
Data correspond to usage on the plateform after 2015. The current usage metrics is available 48-96 hours after online publication and is updated daily on week days.
Initial download of the metrics may take a while.