Fig. 2.
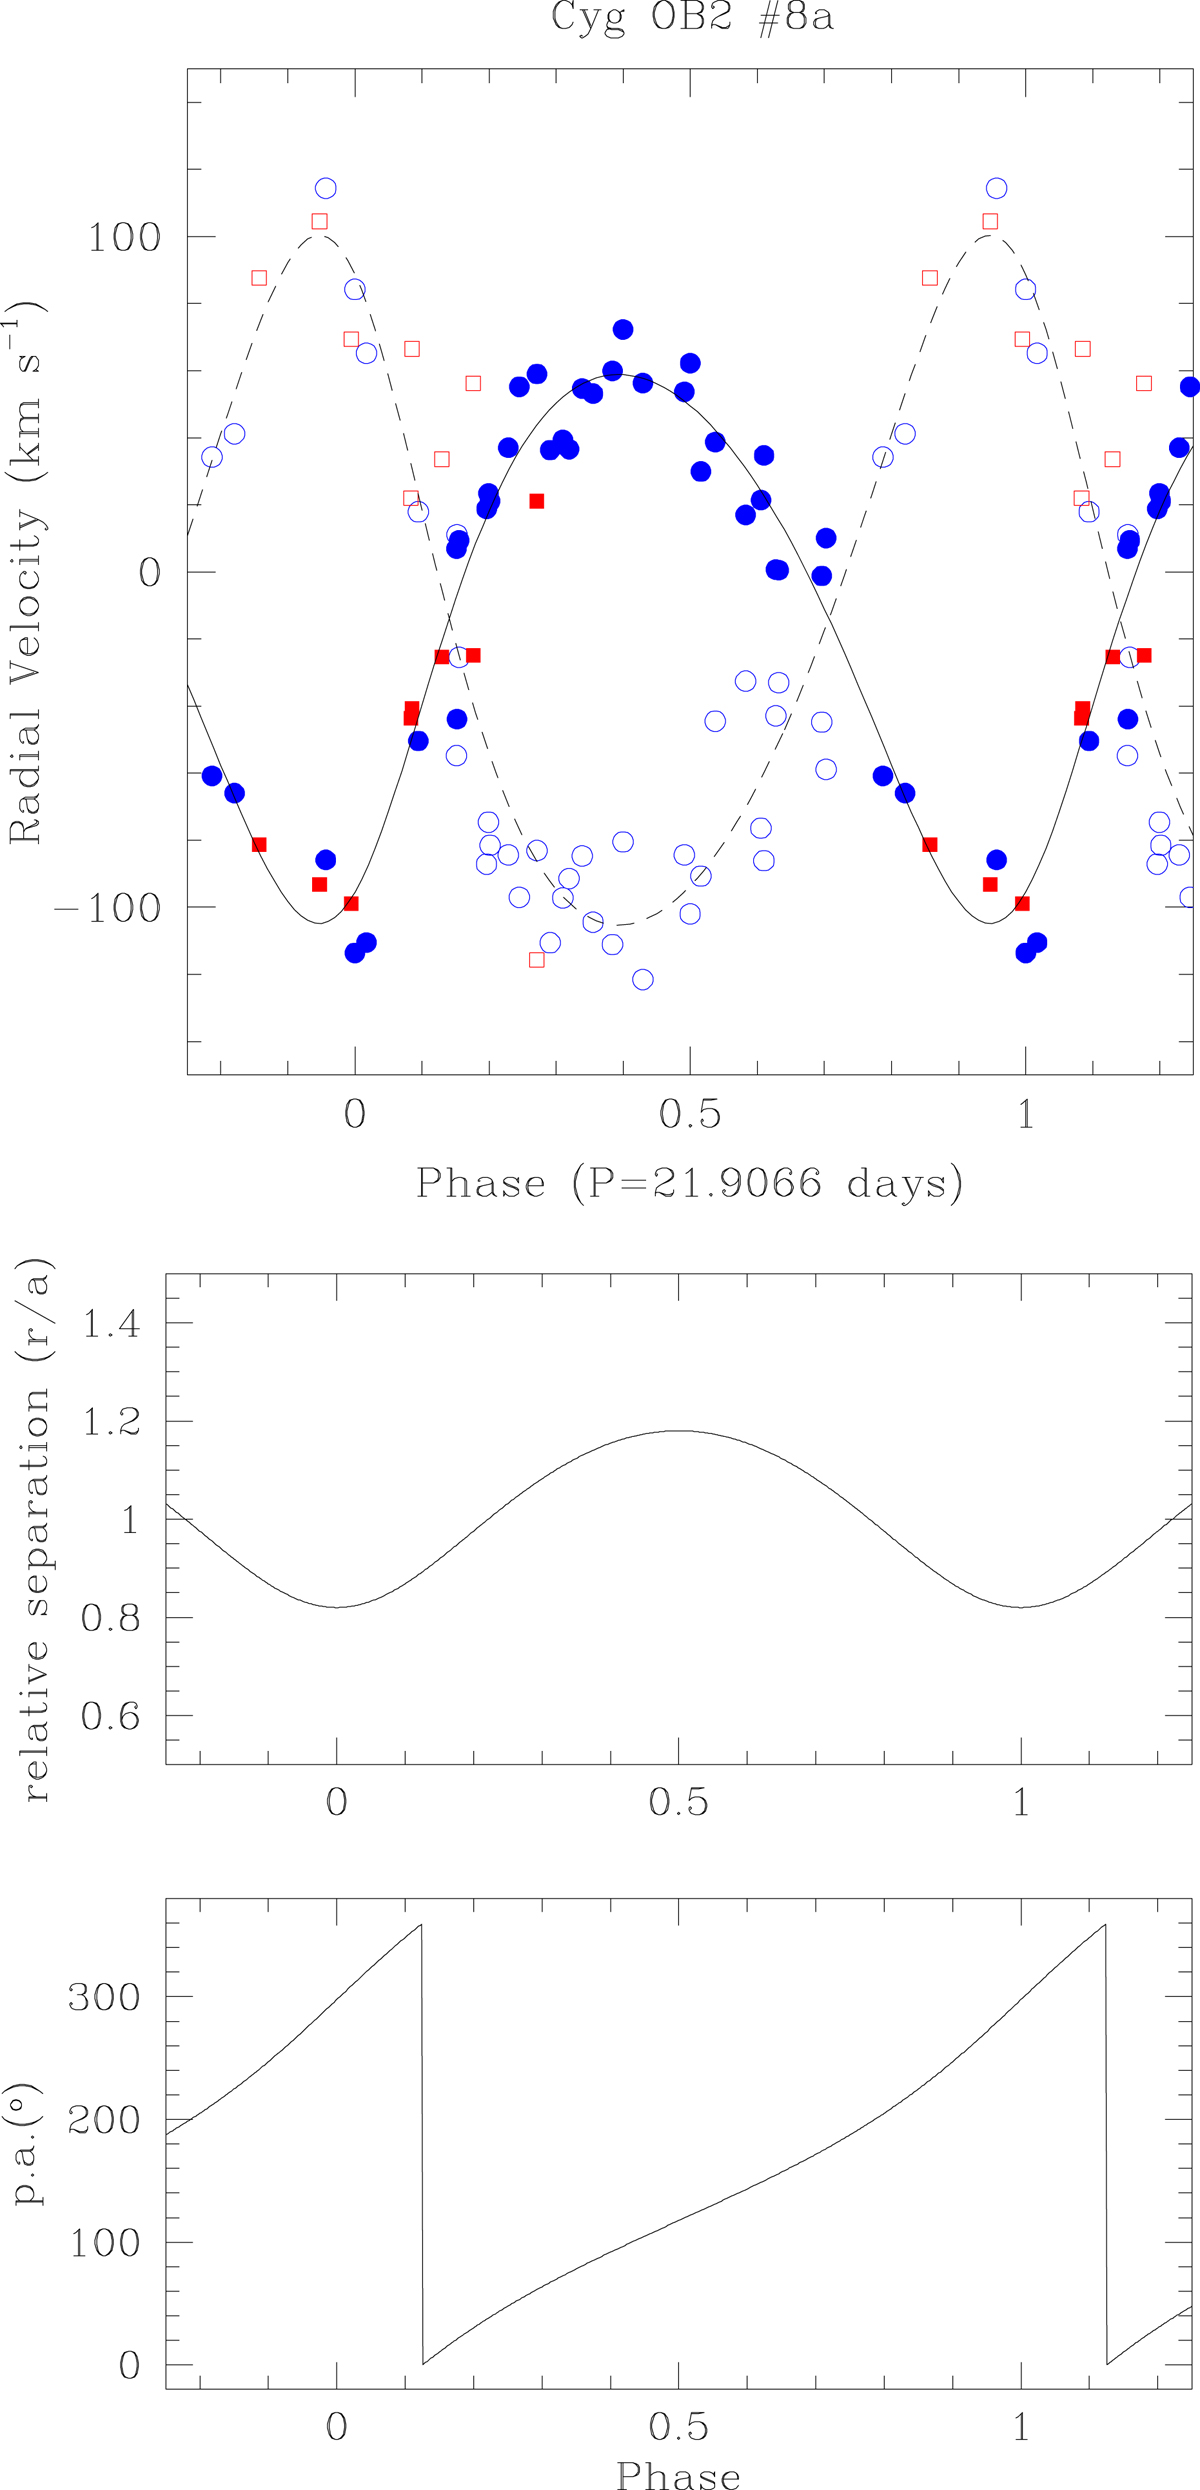
Revised orbital solution of Cyg OB2 #8A. Top panel: primary and secondary RVs are indicated by the filled and open symbols, respectively. The blue dots correspond to the RVs from De Becker et al. (2004), whereas the red squares indicate the new RVs. The solid and dashed lines illustrate the best-fit RV curve (see Table 2). Bottom panels: relative orbital separation and position angle as a function of orbital phase. A value of 0° for the position angle corresponds to the conjunction with the primary star in front.
Current usage metrics show cumulative count of Article Views (full-text article views including HTML views, PDF and ePub downloads, according to the available data) and Abstracts Views on Vision4Press platform.
Data correspond to usage on the plateform after 2015. The current usage metrics is available 48-96 hours after online publication and is updated daily on week days.
Initial download of the metrics may take a while.