Fig. 1
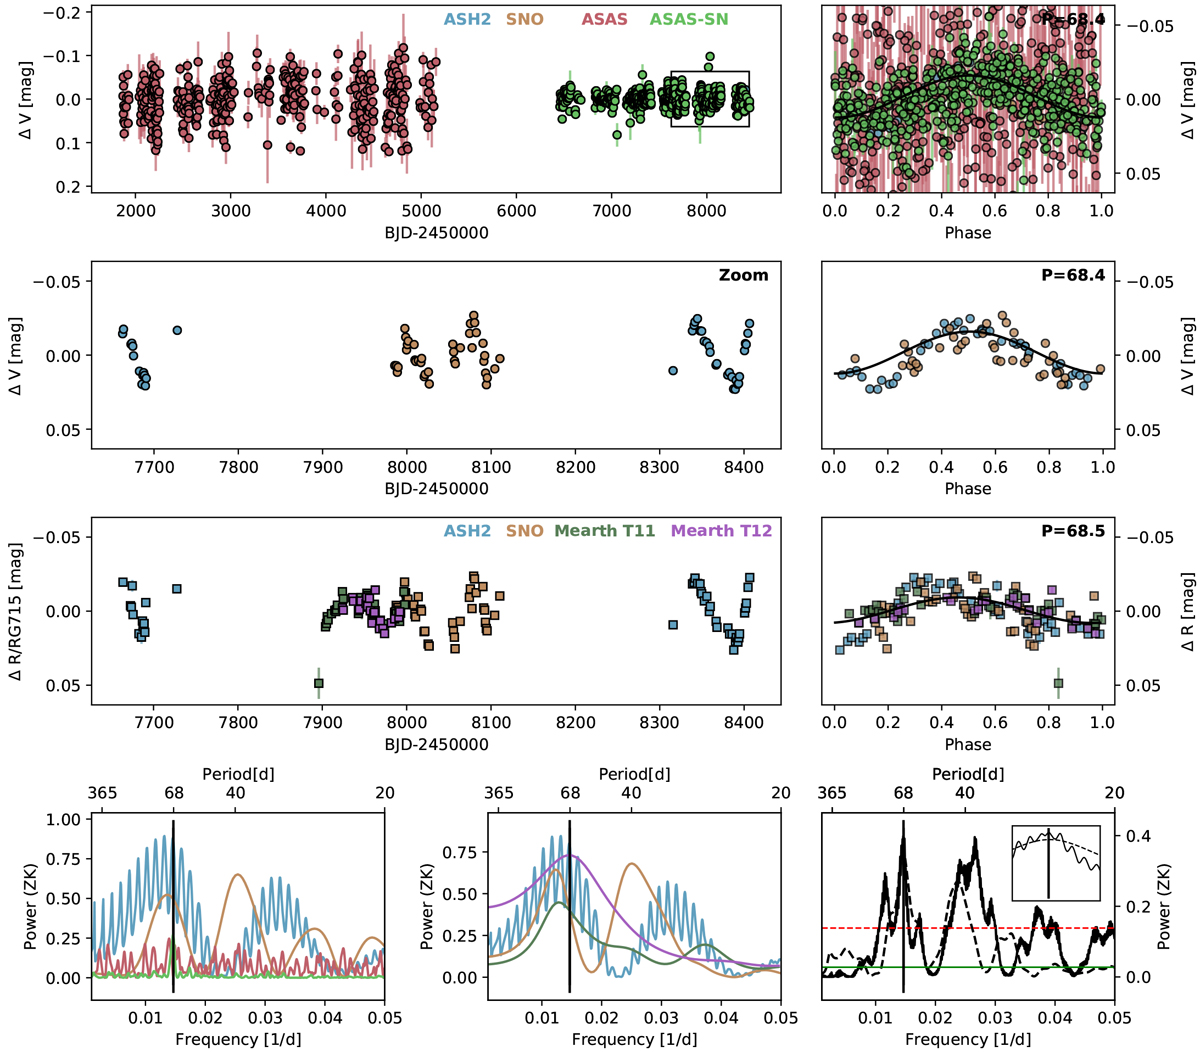
Top three rows: nightly binned photometric time series (top: all data in the V band, middle: zoom to ASH2 and SNO data in the V band, bottom: all data in the R band) and aphase plot to the determined rotation period. Bottom row: periodograms of the different instruments in the V band (left), R band (middle), and the combination of all instruments in each band (right). The periodograms for the analysis on individual instruments are color-coded (blue: ASH2, brown: SNO, red: ASAS, green: ASAS-SN, dark green: MEarth T11, purple:MEarth T12), while the combined periodograms are plotted in black. The solid line represents the combined V -band periodogramand the dashed line the combined R-band periodogram. For the combined periodograms we show the FAP level of 0.001 (green solid line for V band and red dashed line for R band). The vertical black line in each periodogram represents the determined rotation period of 68.4 d and 68.5 d, respectively.
Current usage metrics show cumulative count of Article Views (full-text article views including HTML views, PDF and ePub downloads, according to the available data) and Abstracts Views on Vision4Press platform.
Data correspond to usage on the plateform after 2015. The current usage metrics is available 48-96 hours after online publication and is updated daily on week days.
Initial download of the metrics may take a while.