Fig. 9.
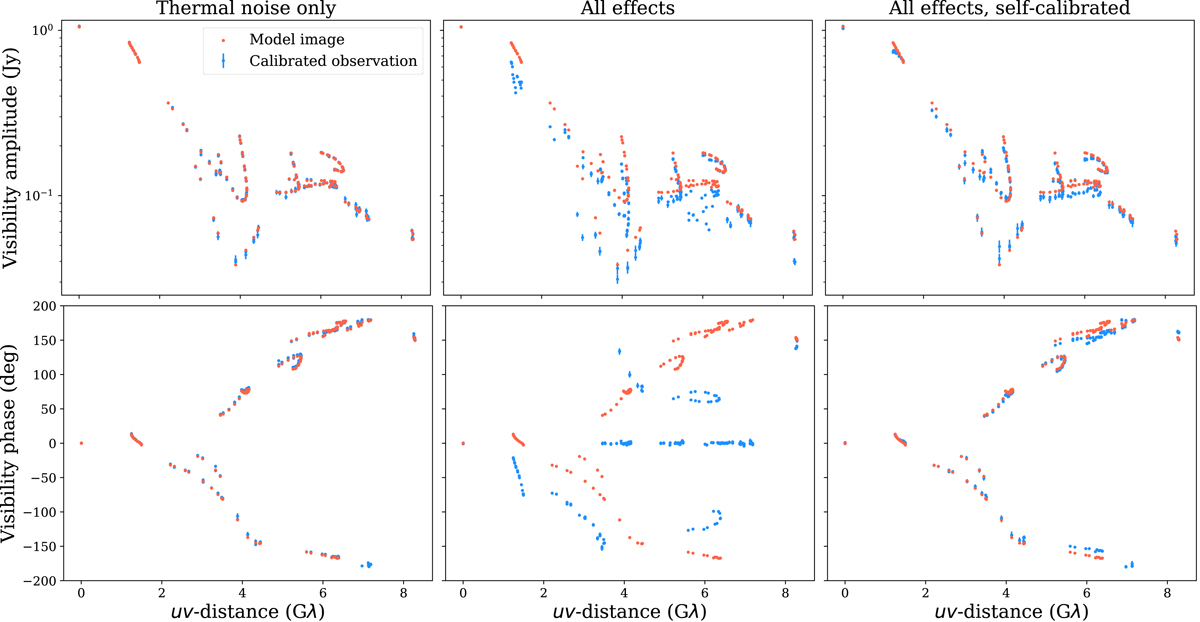
Scan-averaged amplitude (upper panels) and phase (lower panels) versus baseline length of calibrated synthetic data. The κ-jet model (Fig. 6) was used as input, applying either thermal noise only (left panels) or all corruption effects (middle and right panels). Right panels: visibilities that were self-calibrated to the reconstructed image of the source (Fig. 10). For the thermal noise only data, the calibration consists only of averaging in frequency (2 GHz across 64 channels) and time (scan-by-scan). Fringe fitting, amplitude calibration, and network calibration (on data averaged from the initial time resolution of 0.5 s down to 10 s) were applied to the synthetic data with all effects included. In order to make the phases of the self-calibrated reconstruction line up with the model image phases, the reconstruction was shifted in position to align with the thermal noise only reconstruction. The phases were then re-calibrated to this shifted reconstruction.
Current usage metrics show cumulative count of Article Views (full-text article views including HTML views, PDF and ePub downloads, according to the available data) and Abstracts Views on Vision4Press platform.
Data correspond to usage on the plateform after 2015. The current usage metrics is available 48-96 hours after online publication and is updated daily on week days.
Initial download of the metrics may take a while.