Fig. 7.
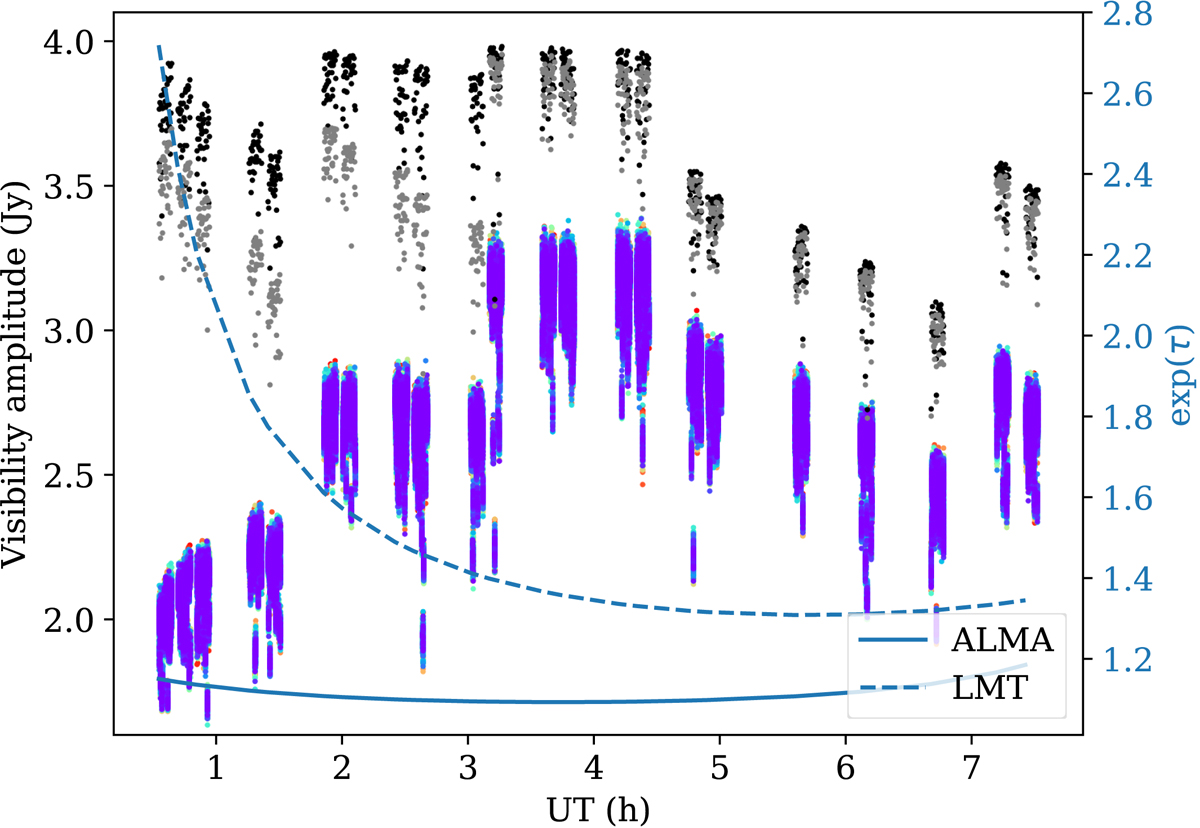
Visibility amplitude versus time at different calibration stages. The amplitudes on the ALMA-LMT baseline observing a 4 Jy point source are shown. The coloured data points represent the 64 channels spanning 2 GHz before calibration, with a time resolution of 1 s. After amplitude calibration, the visibilities are averaged in frequency and down to a time scale of 10 s (grey points). Network calibration is then applied to the averaged data, with a solution interval of 10 s (black points). The amplitude attenuation factors exp(τ) at the centre of the band for the two stations are overplotted as blue lines.
Current usage metrics show cumulative count of Article Views (full-text article views including HTML views, PDF and ePub downloads, according to the available data) and Abstracts Views on Vision4Press platform.
Data correspond to usage on the plateform after 2015. The current usage metrics is available 48-96 hours after online publication and is updated daily on week days.
Initial download of the metrics may take a while.