Fig. 3.
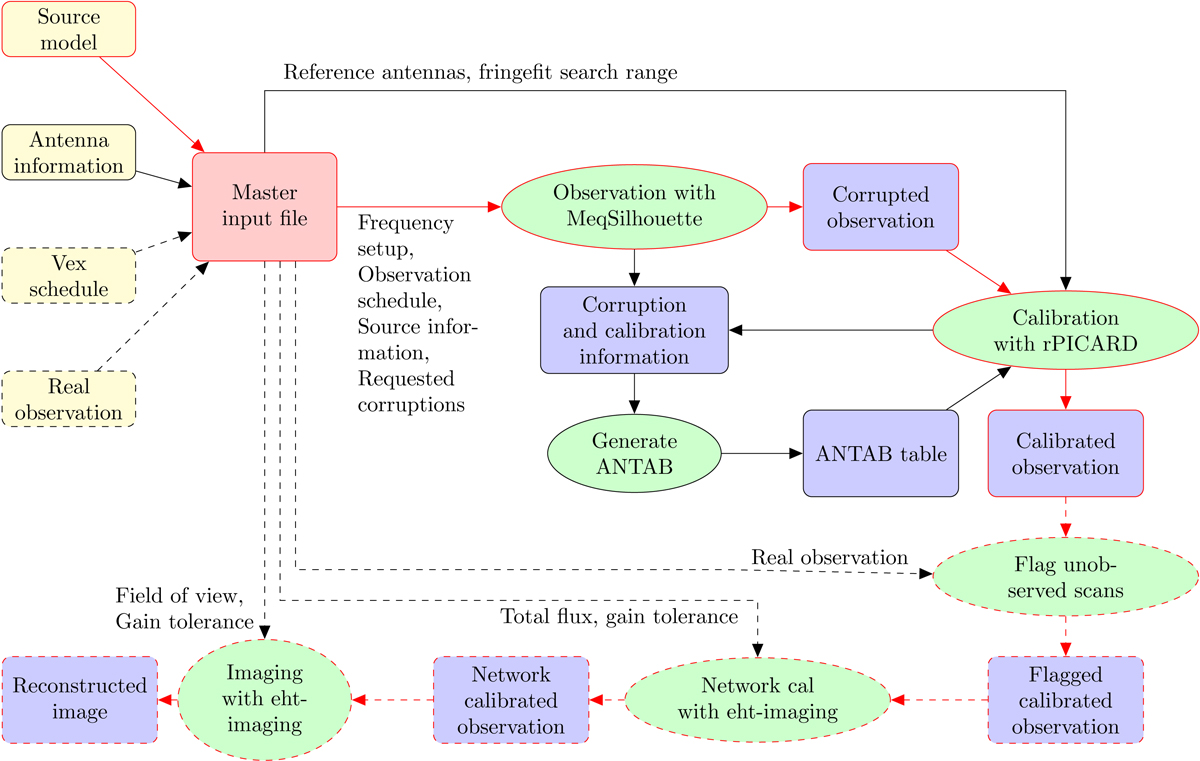
Computing workflow flowchart of SYMBA. Red borders and arrows indicate the main data path. Dashed borders and arrows indicate optional steps that may be skipped (for example, imaging could be done without network calibration). Yellow boxes are auxiliary input files; the master input file is indicated by the red box. Green ellipses are actions, and blue boxes are data products. Text next to arrows lists the information from the master input file that is used for a specific action.
Current usage metrics show cumulative count of Article Views (full-text article views including HTML views, PDF and ePub downloads, according to the available data) and Abstracts Views on Vision4Press platform.
Data correspond to usage on the plateform after 2015. The current usage metrics is available 48-96 hours after online publication and is updated daily on week days.
Initial download of the metrics may take a while.