Fig. 12.
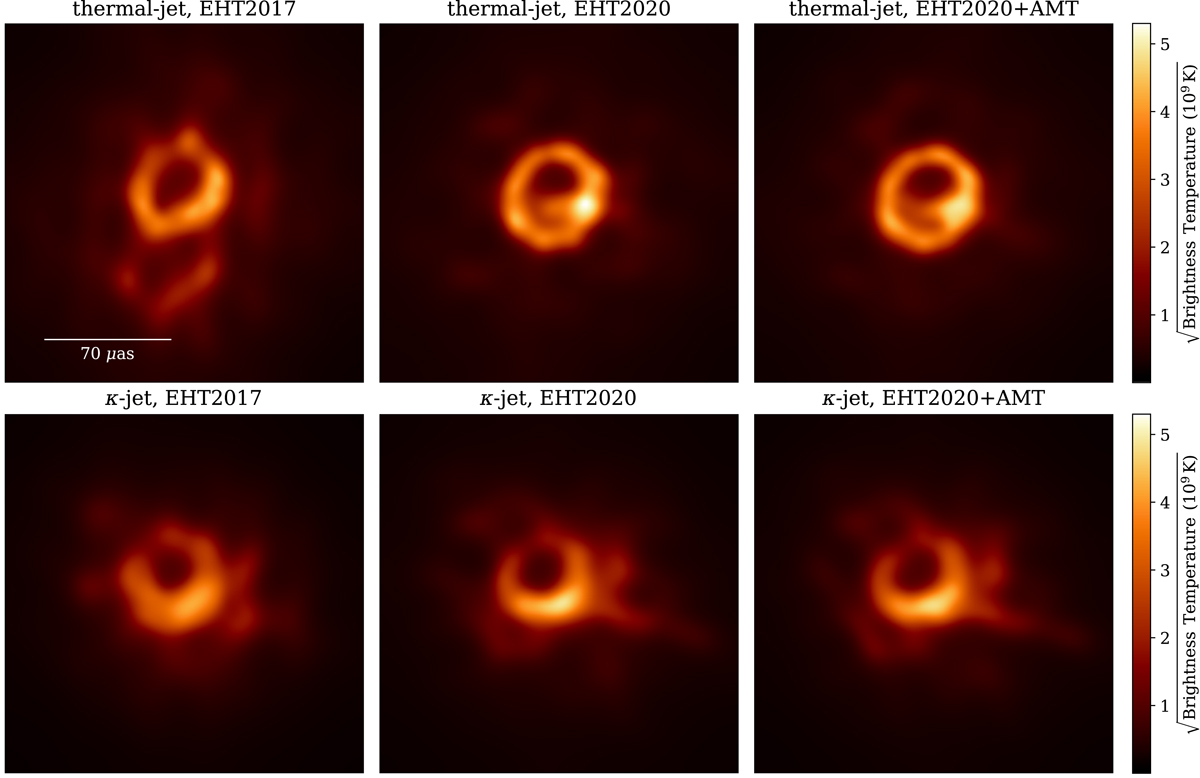
Images reconstructed from synthetic observations with all effects included for different source models and arrays. The reconstructions are for the thermal (top) and κ-jet (bottom) models, using the EHT array in its 2017 configuration (left), with PDB, KP and GLT added as expected for 2020 (middle), and with the AMT, PDB, KP and GLT added (right). The image in the bottom left panel in this figure is the same as the image in the bottom right panel in Fig. 10.
Current usage metrics show cumulative count of Article Views (full-text article views including HTML views, PDF and ePub downloads, according to the available data) and Abstracts Views on Vision4Press platform.
Data correspond to usage on the plateform after 2015. The current usage metrics is available 48-96 hours after online publication and is updated daily on week days.
Initial download of the metrics may take a while.