Fig. 9
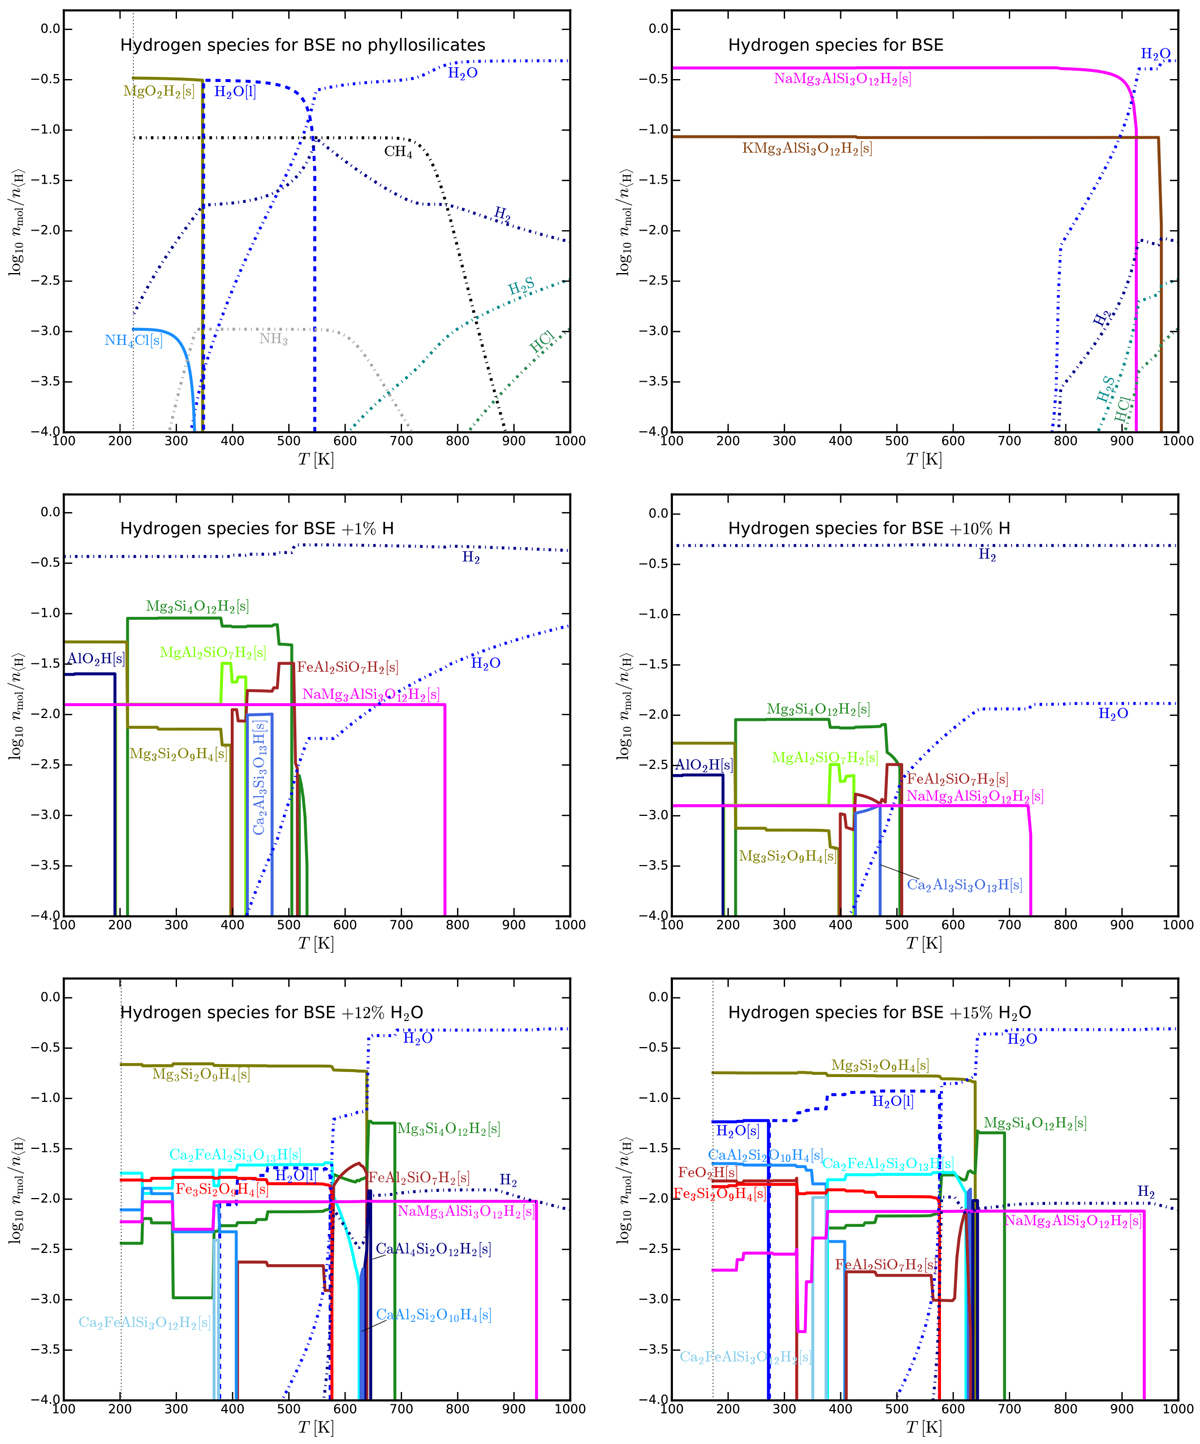
Distribution of hydrogen among the different gas and condensed species. All models are run at 100 bar and for the following abundances: top left panel: BSE without phyllosilicates; top right panel: BSE; middle left panel: BSE + 1.339 wt% H; middle right panel: BSE + 15 wt% H; bottom left panel: BSE + 12 wt% H2O; bottom right panel: BSE + 15 wt% H2O. The threshold concentration for species to be shown is set to 10−3 for all abundances except for BSE + 10% H (10−3.5).
Current usage metrics show cumulative count of Article Views (full-text article views including HTML views, PDF and ePub downloads, according to the available data) and Abstracts Views on Vision4Press platform.
Data correspond to usage on the plateform after 2015. The current usage metrics is available 48-96 hours after online publication and is updated daily on week days.
Initial download of the metrics may take a while.