Fig. 3
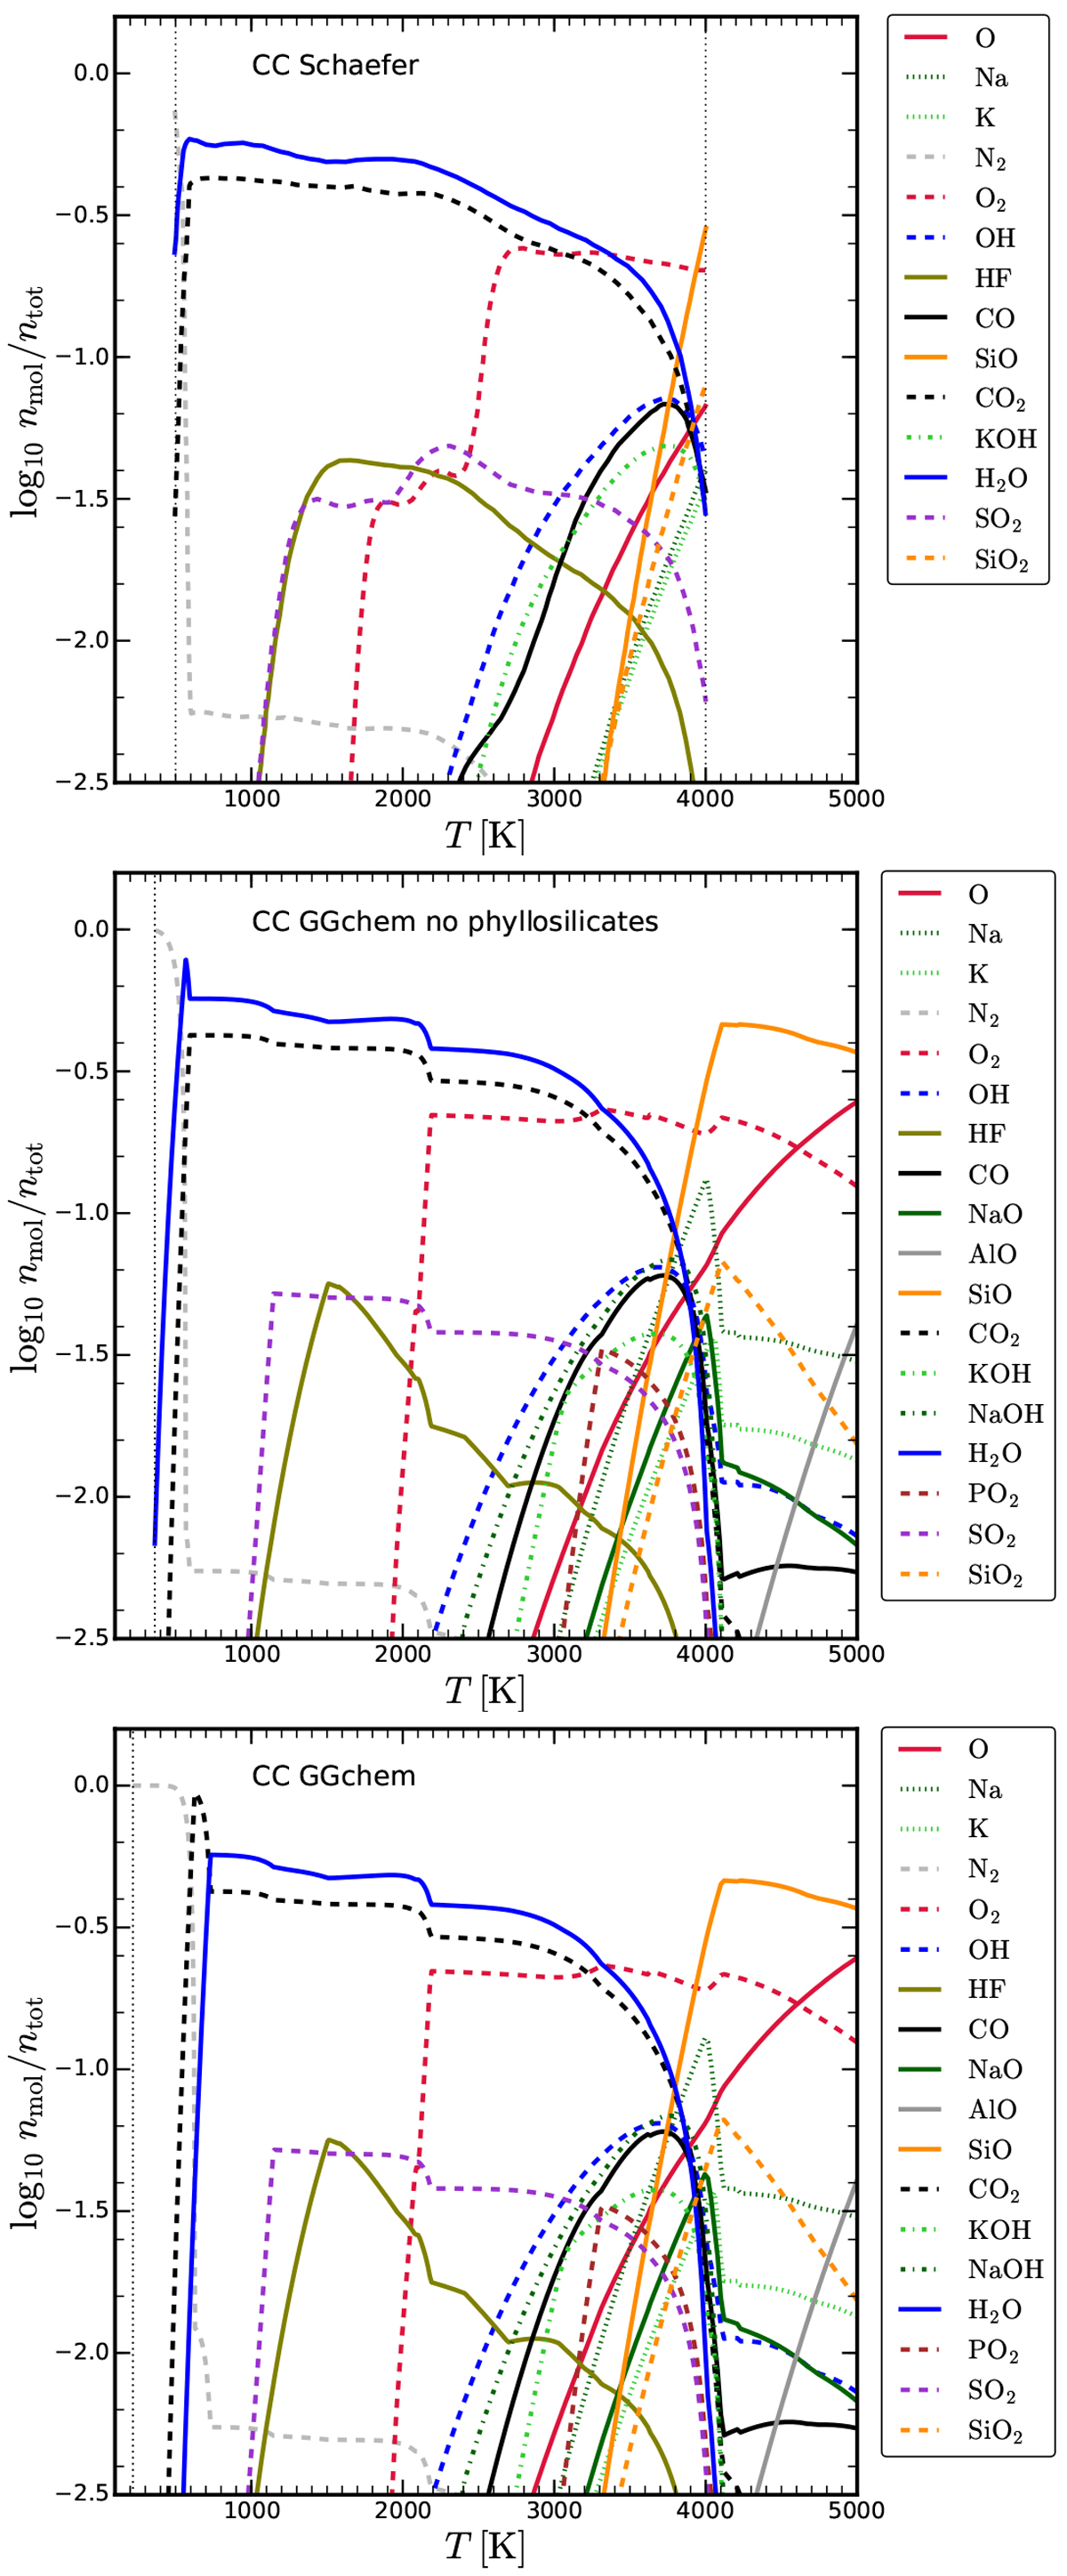
Comparing the molecular concentrations (nmol∕ntot) over Continental Crust (CC) at P = 100 bar predicted by GGCHEM with the results obtained by Schaefer et al. (2012). Top panel: results by Schaefer et al. (2012) scanned from their Fig. 1. Middle panel: results from GGCHEM disregarding phyllosilicates. Bottom panel: results from GGCHEM for the full dataset. All species with log nmol∕ntot > 1.5 are shown. The thin, vertical dotted lines indicate the upper and lower limits of the models. For the GGCHEM models this means that all elements are condensed below the corresponding temperature.
Current usage metrics show cumulative count of Article Views (full-text article views including HTML views, PDF and ePub downloads, according to the available data) and Abstracts Views on Vision4Press platform.
Data correspond to usage on the plateform after 2015. The current usage metrics is available 48-96 hours after online publication and is updated daily on week days.
Initial download of the metrics may take a while.