Fig. 2
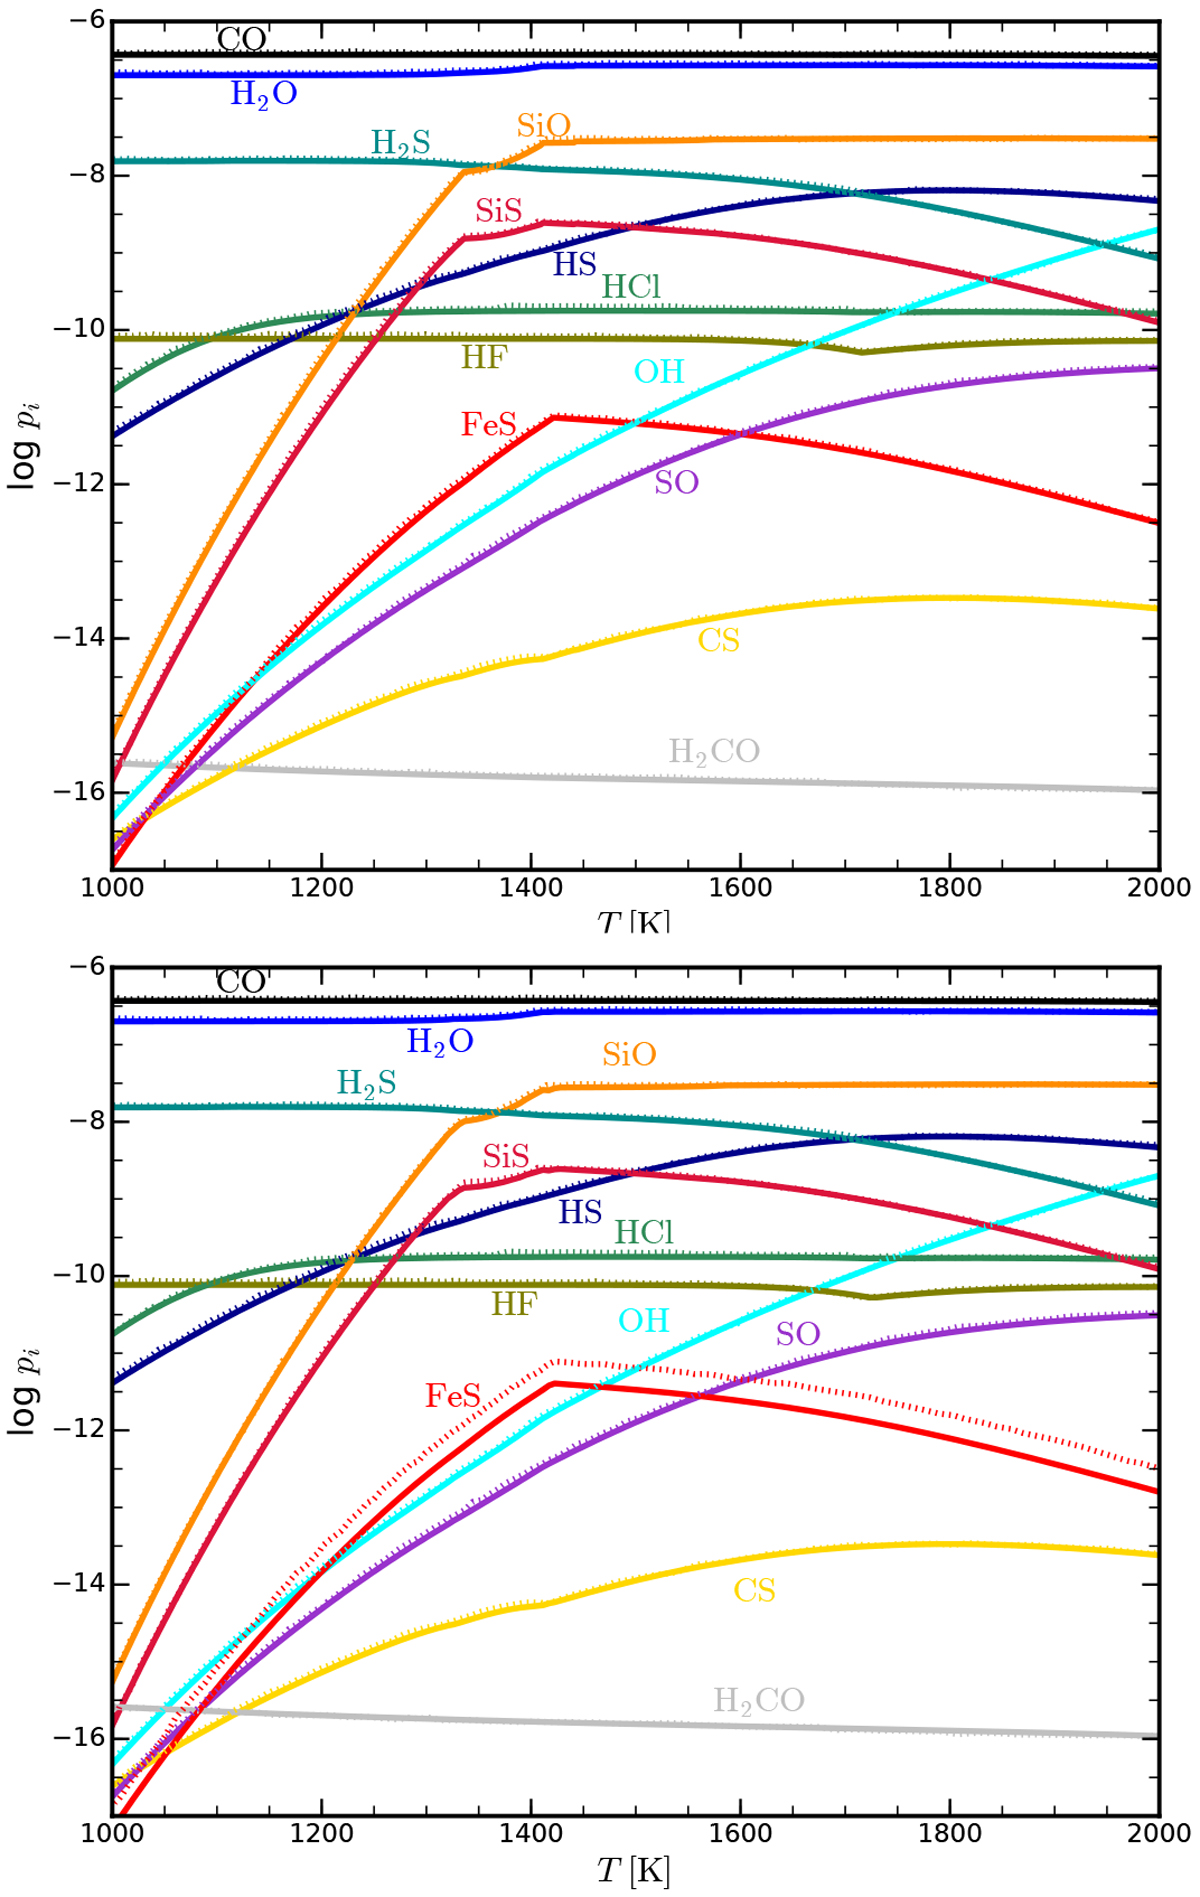
Comparison of molecular partial pressures computed by GGCHEM (solid lines) to the results by Sharp & Huebner (1990, dotted lines). Calculations are based on the solar element abundances listed in Sharp & Huebner (1990) for a constant pressure of p = 0.5 mbar. The shown elements are chosen to match Fig. 1 in Sharp & Huebner (1990). Upper panel: GGCHEM only uses the molecules and condensates selected by Sharp & Huebner (1990) and applies their thermo-chemical data. Lower panel: GGCHEM uses all molecules and condensates found in its own database and uses its own thermo-chemical data. The agreement is very good. The only visible difference is in FeS, which is slightly depleted in the lower panel.
Current usage metrics show cumulative count of Article Views (full-text article views including HTML views, PDF and ePub downloads, according to the available data) and Abstracts Views on Vision4Press platform.
Data correspond to usage on the plateform after 2015. The current usage metrics is available 48-96 hours after online publication and is updated daily on week days.
Initial download of the metrics may take a while.