Fig. 10
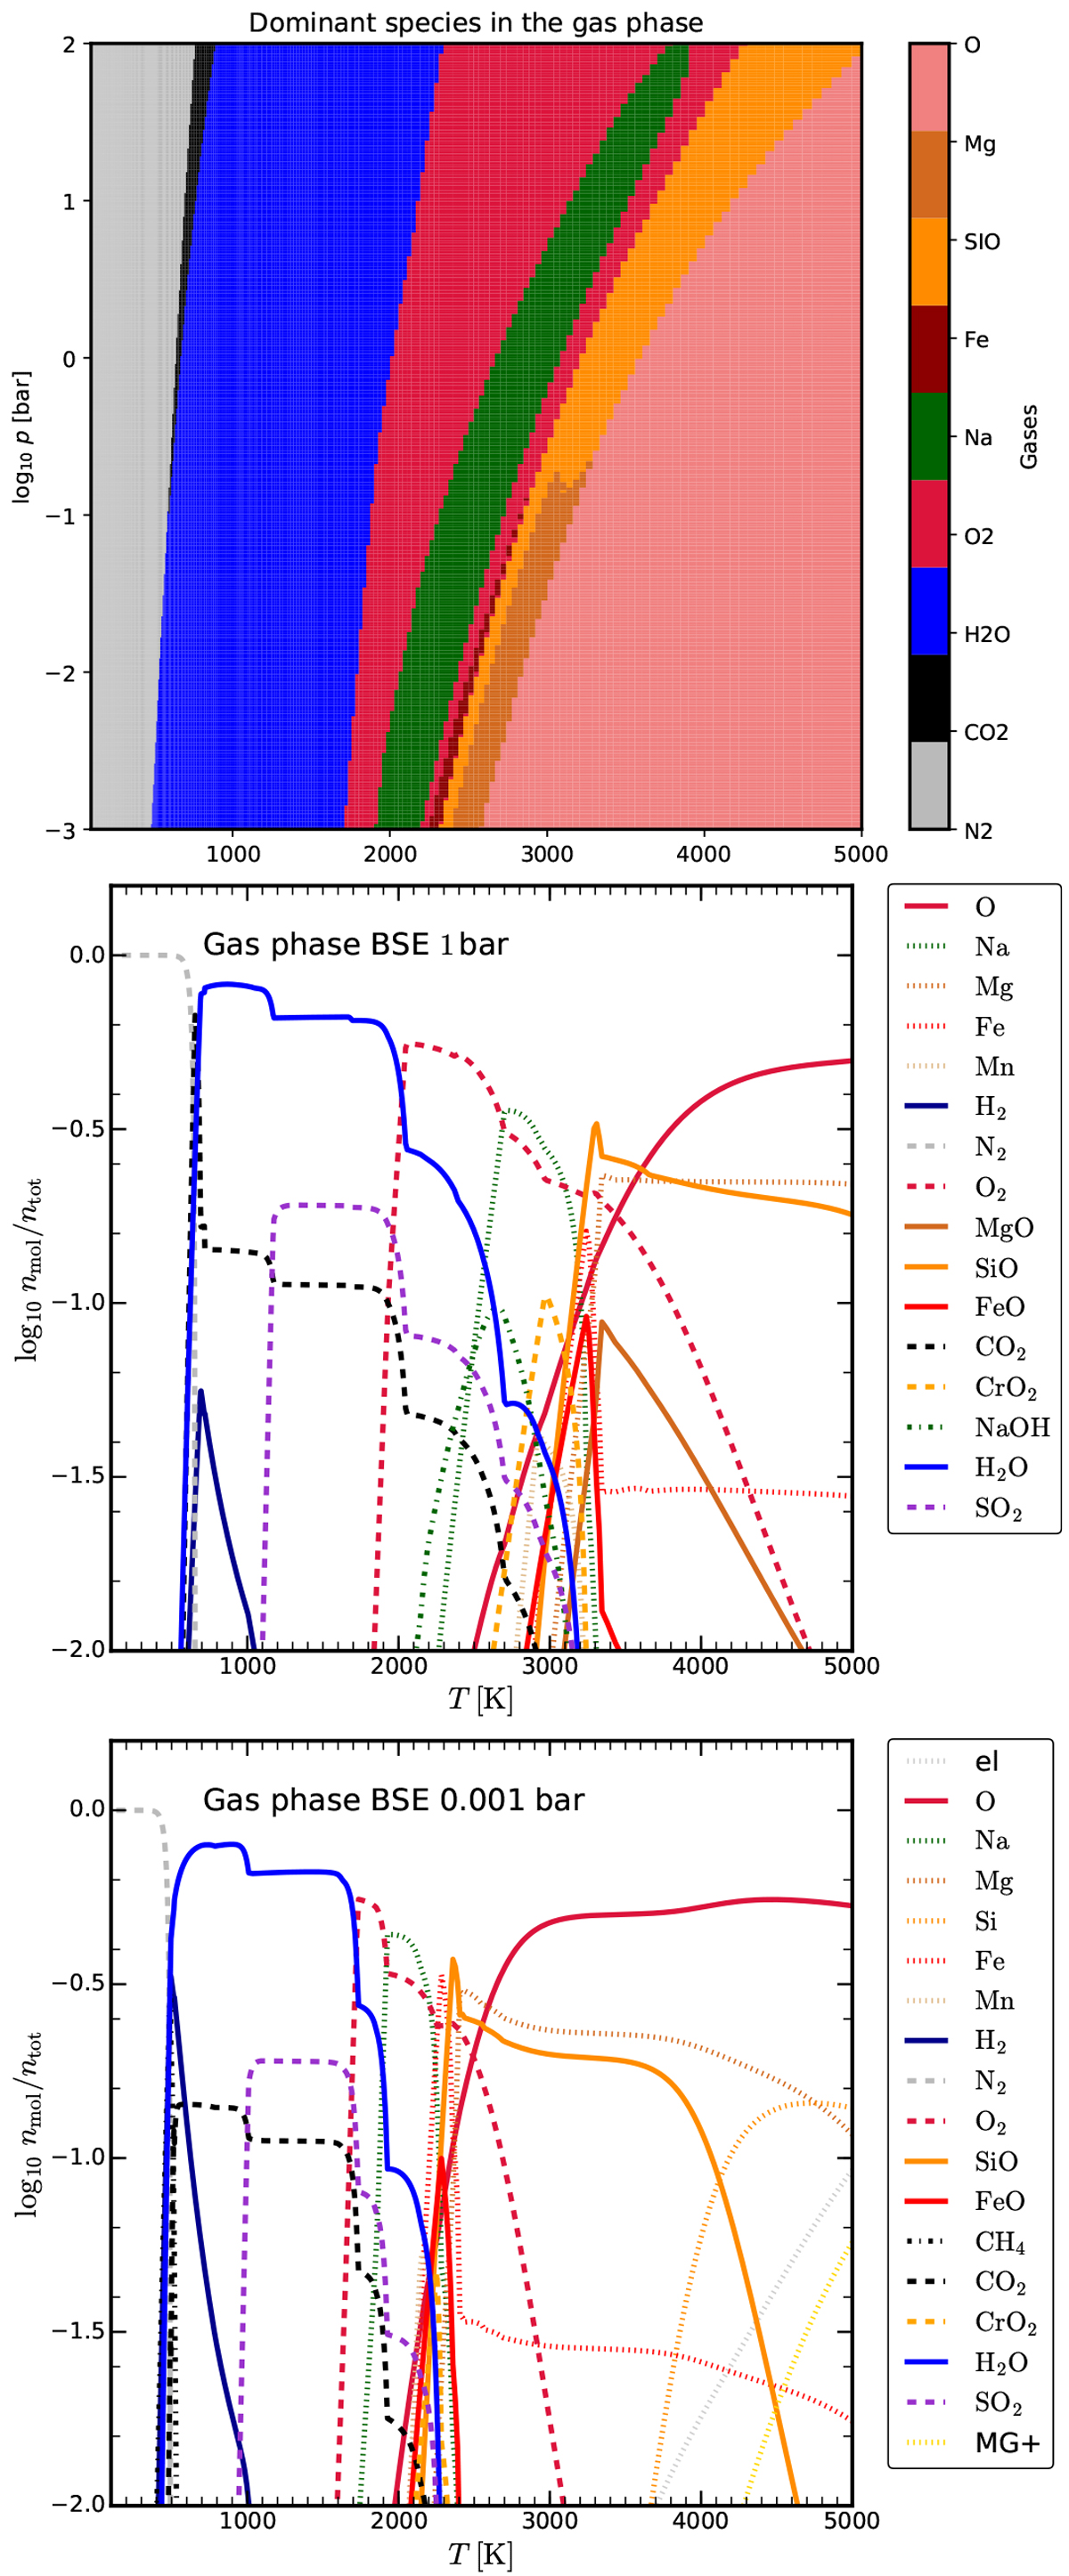
Results for BSE total abundances at different pressures. Upper panel: dominant gas species with respect to the highest concentration in the p−T plane. Middle panel: gas concentrations (nmol∕ntot) at p = 1 bar. Lower panel:gas concentrations (nmol∕ntot) at p = 0.001 bar. The transitions in composition are caused by phase changes as listed in Table A.3. Further pressure levels are shown in Fig. A.1.
Current usage metrics show cumulative count of Article Views (full-text article views including HTML views, PDF and ePub downloads, according to the available data) and Abstracts Views on Vision4Press platform.
Data correspond to usage on the plateform after 2015. The current usage metrics is available 48-96 hours after online publication and is updated daily on week days.
Initial download of the metrics may take a while.