Fig. 6.
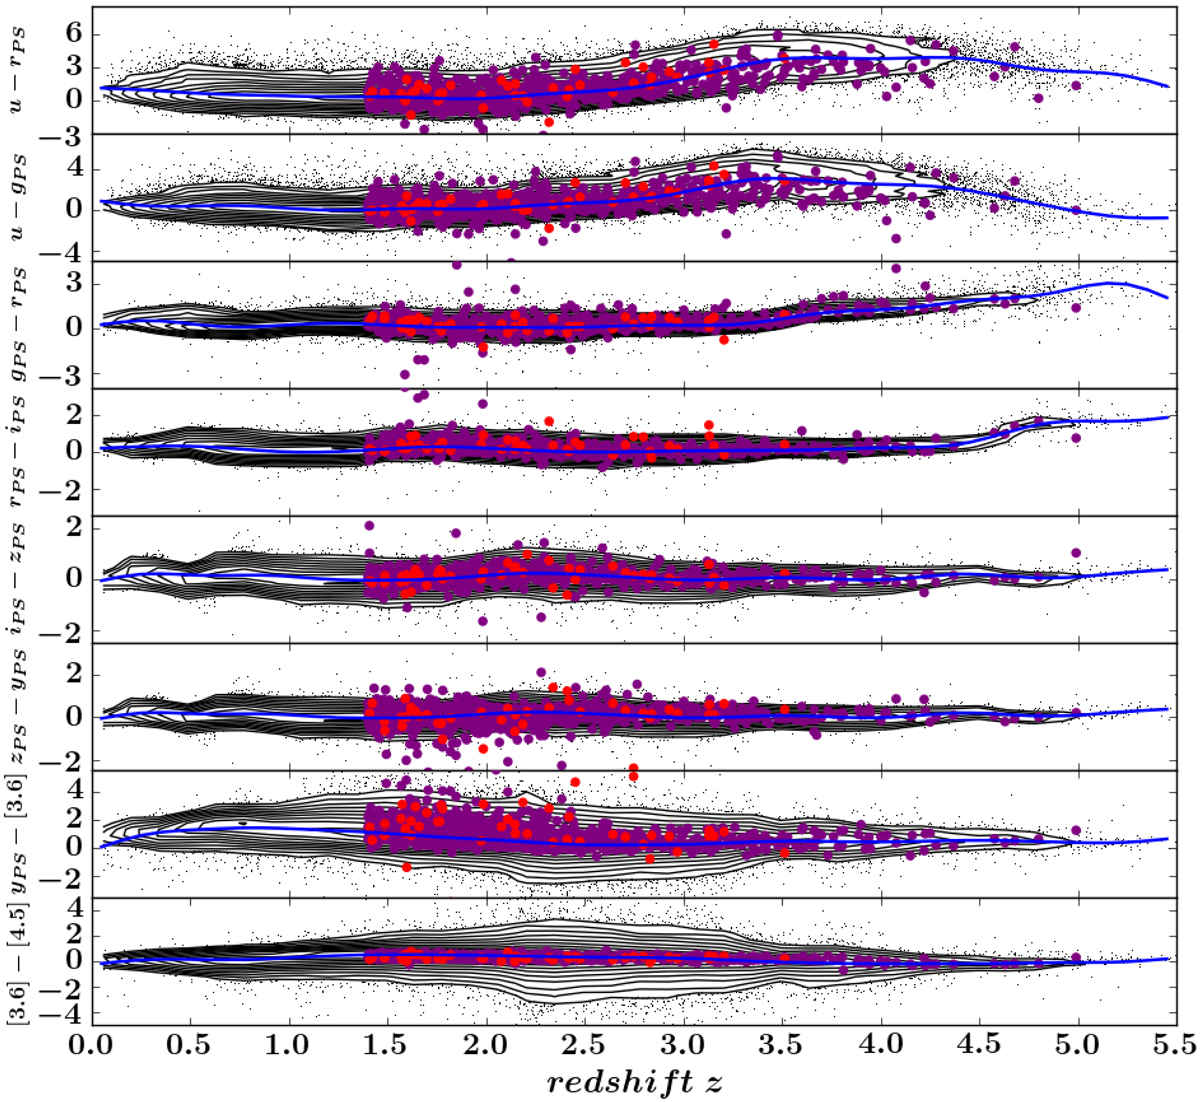
Quasar colors versus redshift for different quasar samples between z = 1.4 and z = 5.5. Red points: RSQs with photometric redshifts; purple points: Boötes spectroscopic quasars; black contours and points: color distributions of the quasar training sample from Sect. 2.3; blue lines: mean color–redshift relations derived from the quasar training sample.
Current usage metrics show cumulative count of Article Views (full-text article views including HTML views, PDF and ePub downloads, according to the available data) and Abstracts Views on Vision4Press platform.
Data correspond to usage on the plateform after 2015. The current usage metrics is available 48-96 hours after online publication and is updated daily on week days.
Initial download of the metrics may take a while.