Fig. 22.
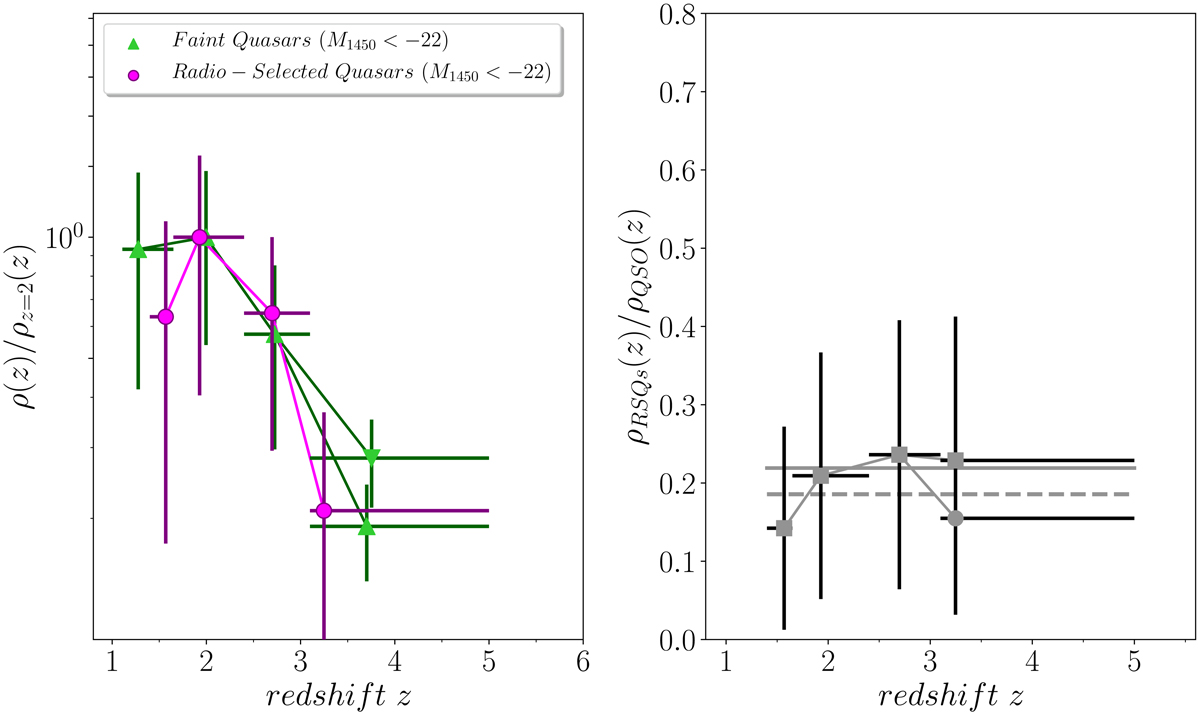
Left panel: spatial densities, normalized to z ∼ 2, as a function of redshift for optically faint quasars and RSQs. Our results are indicated by fuchsia circles, while the spatial density for faint quasars is determined from results reported in the literature (Bongiorno et al. 2007; Siana et al. 2008; Glikman et al. 2011; Masters et al. 2012; Akiyama et al. 2018; Yang et al. 2018) and is denoted by green triangles. The downward triangle indicates the spatial density excluding the results by Glikman et al. (2011) and Akiyama et al. (2018), while the value denoted the downward triangle includes them. Right panel: relative fraction of RSQs with respect to the spatial density of faint quasars as a function of redshift. The ratio is calculated between overlapping redshift bins. The gray solid line indicates the mean ratio of 0.22 excluding the works by Glikman et al. (2011) and Akiyama et al. (2018), while the dashed line denotes a mean ratio of 0.18 including these works.
Current usage metrics show cumulative count of Article Views (full-text article views including HTML views, PDF and ePub downloads, according to the available data) and Abstracts Views on Vision4Press platform.
Data correspond to usage on the plateform after 2015. The current usage metrics is available 48-96 hours after online publication and is updated daily on week days.
Initial download of the metrics may take a while.