Fig. 21.
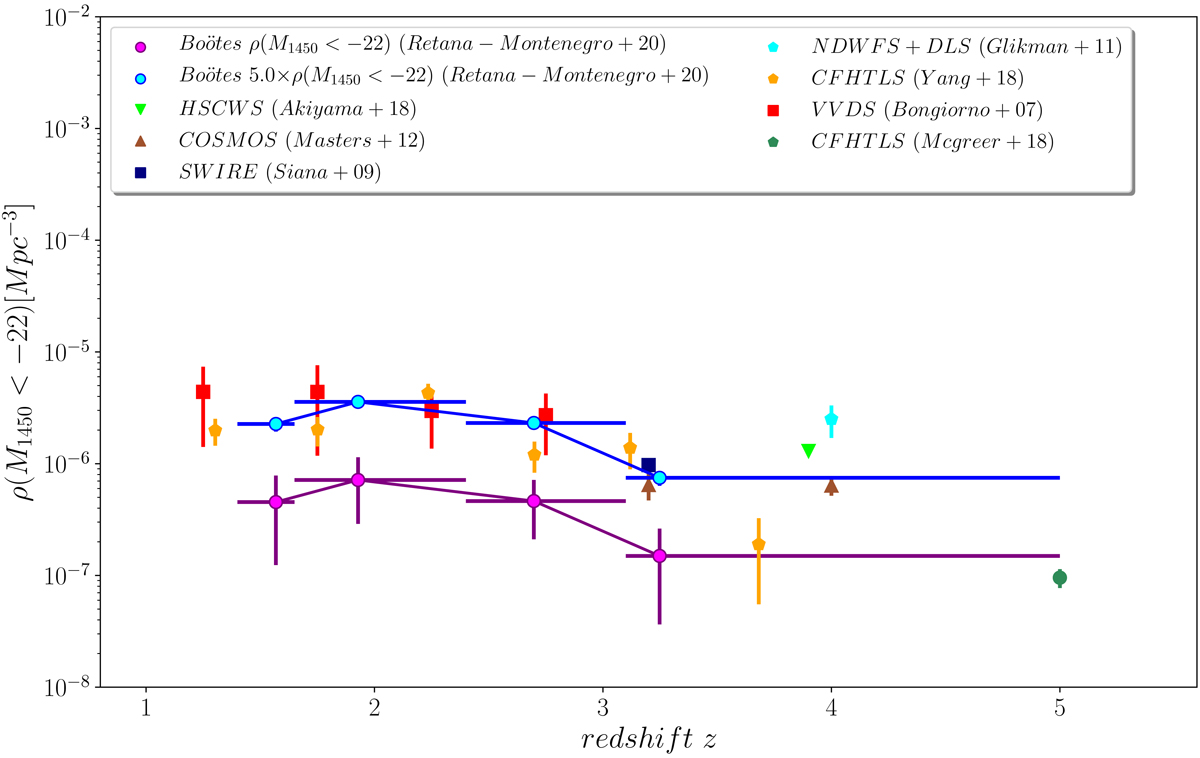
Spatial density of RSQs with M1450 < −22 as a function of redshift compared to the space density of faint quasar samples (M1450 < −22) from the literature. The spatial density of RSQs is indicated by purple circles, while estimates from the literature (Bongiorno et al. 2007; Siana et al. 2008; Glikman et al. 2011; Masters et al. 2012; Akiyama et al. 2018; Yang et al. 2018; McGreer et al. 2018) are represented by the corresponding symbols in the legend box. We also plot the spatial density of RSQs scaled by a factor of 5.0 (1/0.20) (blue circles).
Current usage metrics show cumulative count of Article Views (full-text article views including HTML views, PDF and ePub downloads, according to the available data) and Abstracts Views on Vision4Press platform.
Data correspond to usage on the plateform after 2015. The current usage metrics is available 48-96 hours after online publication and is updated daily on week days.
Initial download of the metrics may take a while.