Fig. 20.
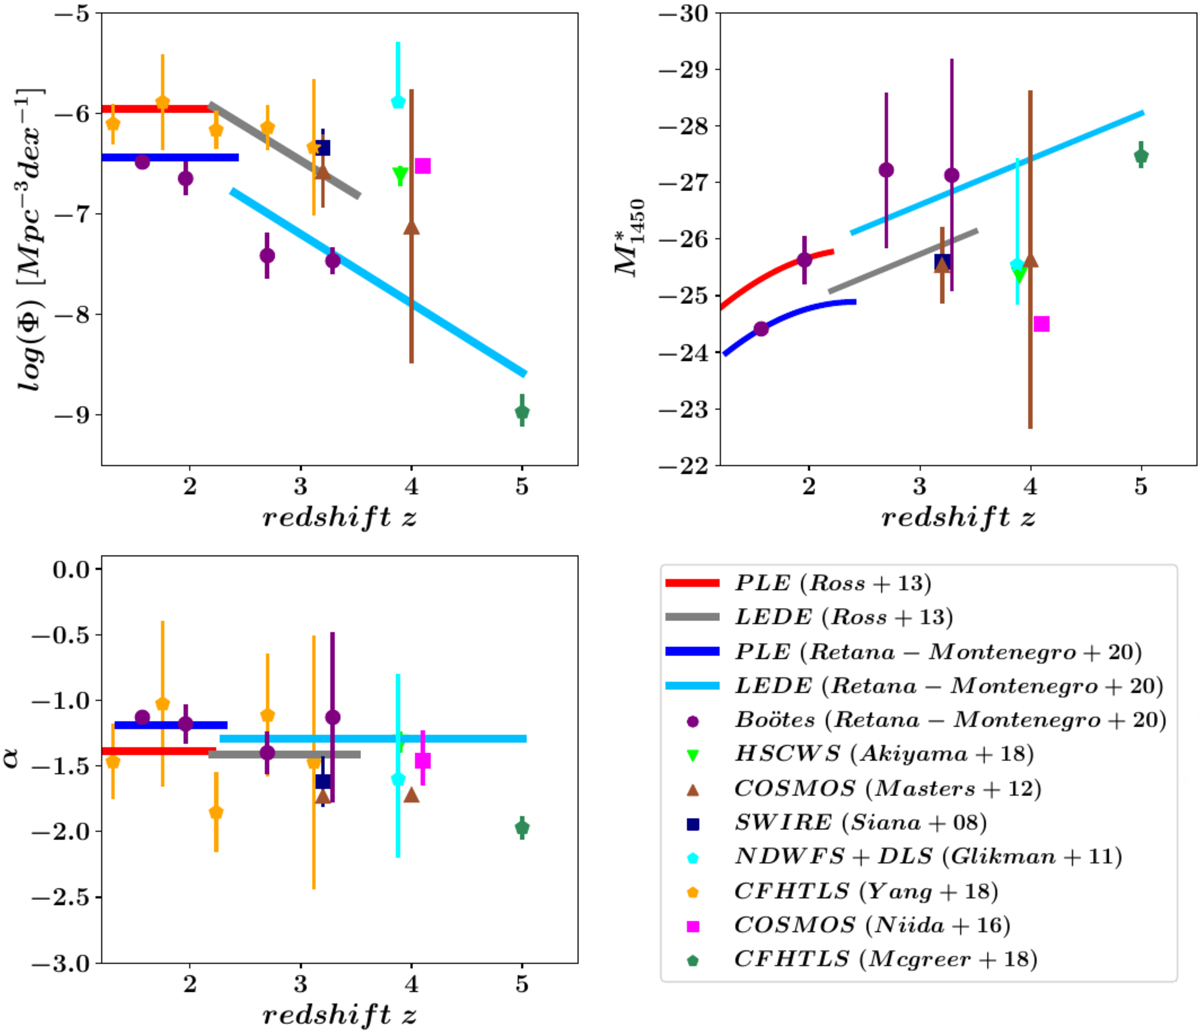
Best-fit quasar luminosity function parameters as a function of redshift. Our results are indicated by purple circles, while estimates from the literature (Siana et al. 2008; Glikman et al. 2011; Masters et al. 2012; Niida et al. 2016; Akiyama et al. 2018; Yang et al. 2018; McGreer et al. 2018) are represented by the corresponding symbols in the legend box. The red and gray lines represent the PLE and LEDE models from Ross et al. (2013), and the blue and dark cyan lines our PLE (1.4 < z < 2.4) and LEDE (2.4 < z < 5.0) models listed on Table 6. For clarity, we shift vertically the PLE and LEDE models from Ross et al. (2013) by a factor of +0.1 in the third panel.
Current usage metrics show cumulative count of Article Views (full-text article views including HTML views, PDF and ePub downloads, according to the available data) and Abstracts Views on Vision4Press platform.
Data correspond to usage on the plateform after 2015. The current usage metrics is available 48-96 hours after online publication and is updated daily on week days.
Initial download of the metrics may take a while.