Fig. 17.
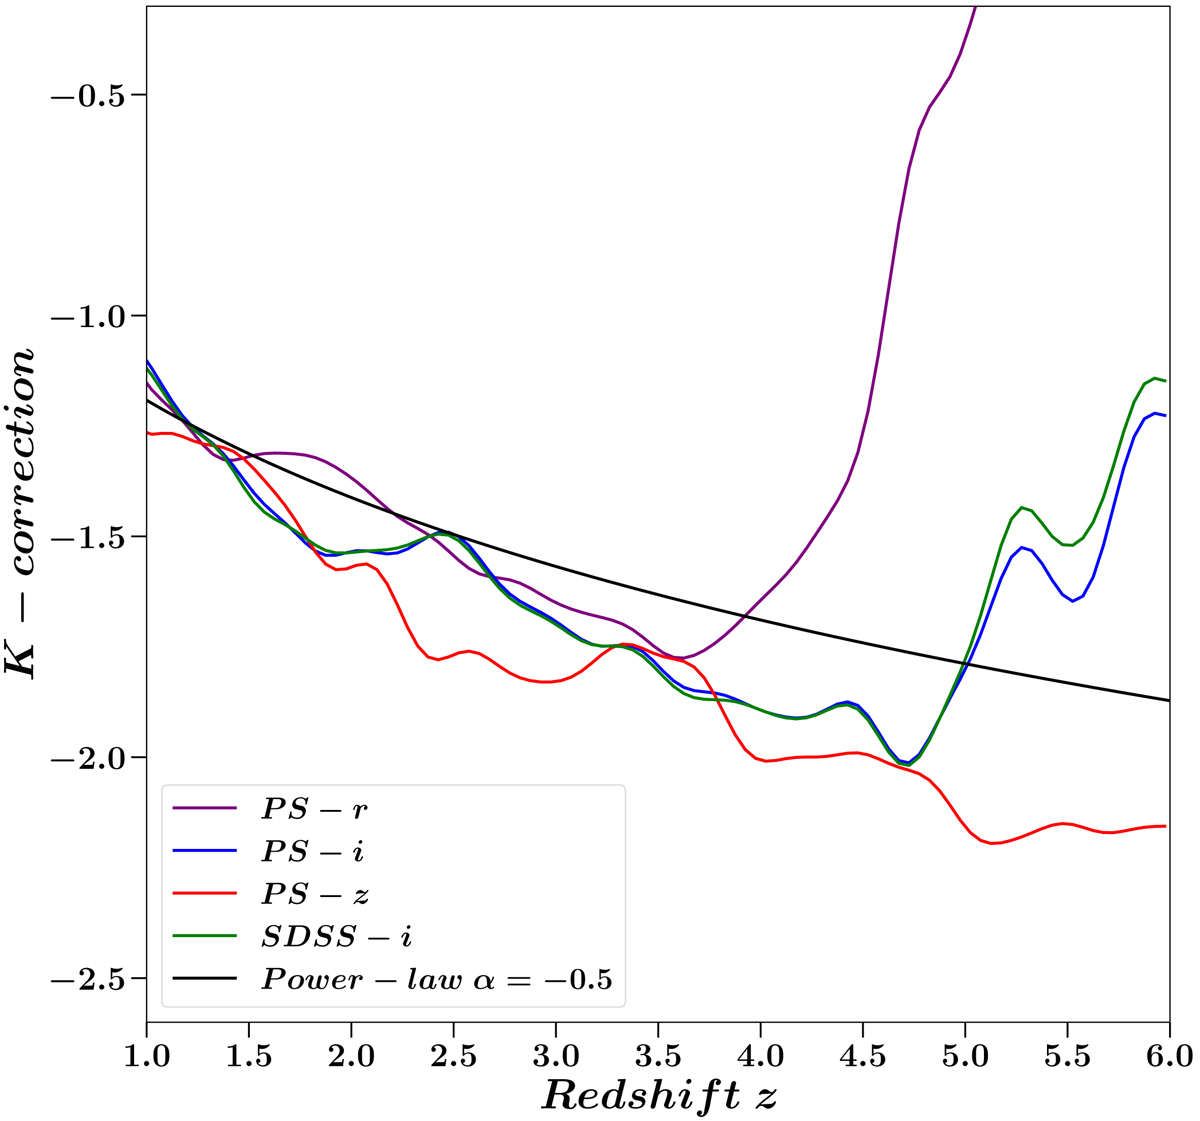
K-correction for different filters determined using our simulated quasar spectra. The Pan-STARRS1 rPS and iPS filters are indicated by blue and green, while the red and cyan are the expected K-corrections for the Pan-STARRS1 zPS and SDSS-i bands. The solid black line is the K-correction assuming a power-law with slope α = −0.5 with no emission line contribution or Lyα forest blanketing. At z ≳ 3.7, the difference between the rPS and iPS bands becomes more significant as the Lyα line moves in or out of the filters. The same situation occurs at z ≳ 3.7, but for the iPS and zPS bands.
Current usage metrics show cumulative count of Article Views (full-text article views including HTML views, PDF and ePub downloads, according to the available data) and Abstracts Views on Vision4Press platform.
Data correspond to usage on the plateform after 2015. The current usage metrics is available 48-96 hours after online publication and is updated daily on week days.
Initial download of the metrics may take a while.