Fig. 11.
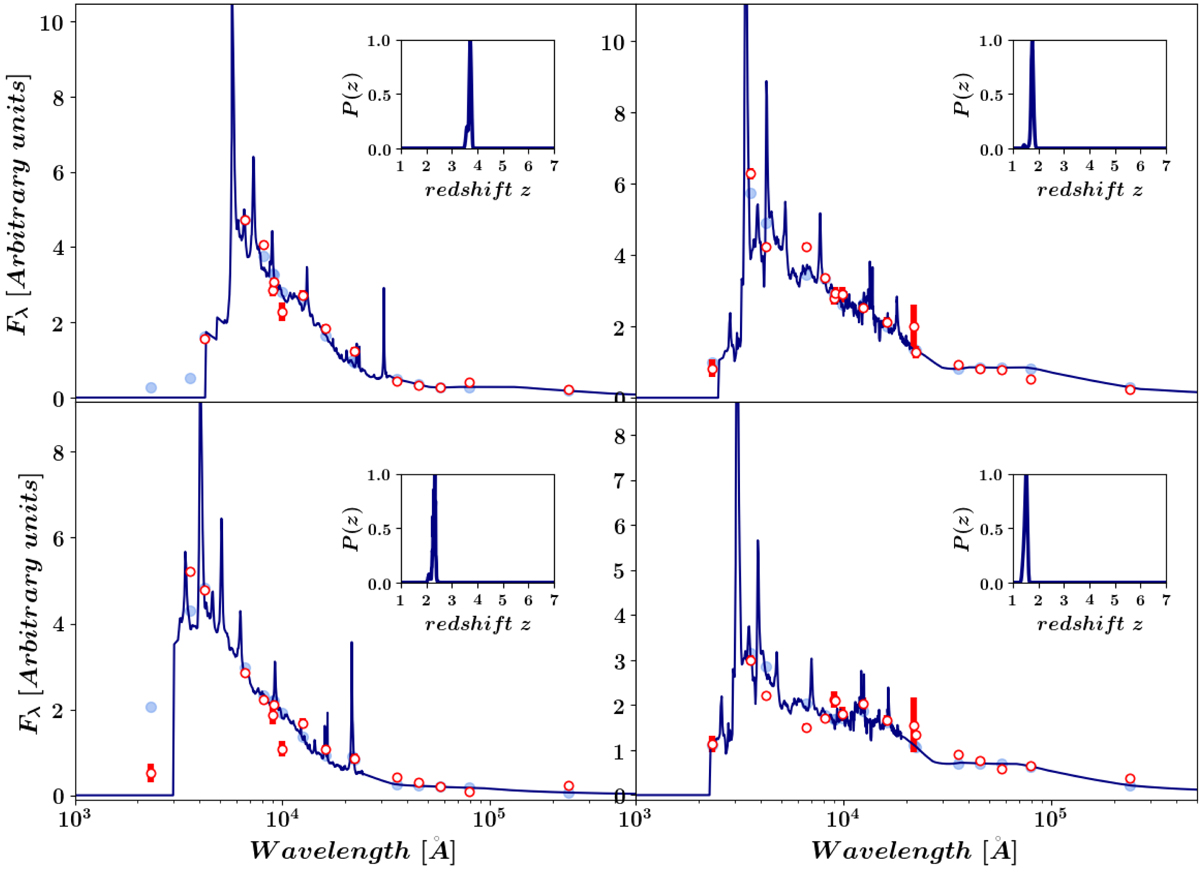
Spectral energy distributions (SEDs) of four photometric quasars identified using our ML algorithms (see Sect. 3.3). The NDWFS-Boötes photometry is used to calculate the SEDs. In each case the best-fit quasar template (as derived from the EAZY calculation) is also plotted. Red circles are the photometric points and the blue circles indicate the predicted photometry by the best-fit template. The probability density distributions (PDFs) for each object are shown in the small inset. These PDFs strongly suggest that these objects are quasars located at z > 1.4.
Current usage metrics show cumulative count of Article Views (full-text article views including HTML views, PDF and ePub downloads, according to the available data) and Abstracts Views on Vision4Press platform.
Data correspond to usage on the plateform after 2015. The current usage metrics is available 48-96 hours after online publication and is updated daily on week days.
Initial download of the metrics may take a while.