Fig. 4
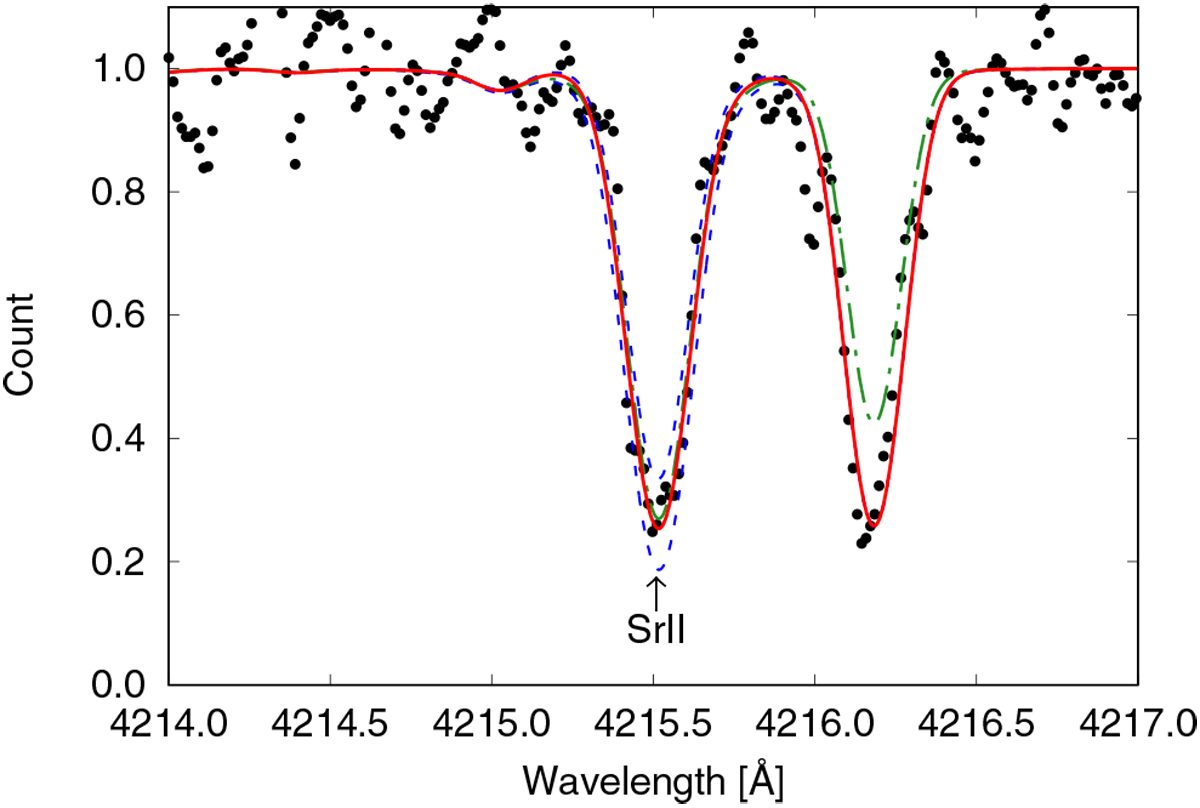
Observed Sr line of S 11-04 at 4215 Å (dots). The red solid line shows the synthetic spectra for the abundance derived by our analysis. The blue dashed lines are the spectra calculated after changing the Sr abundance by ±0.5 dex. The green dot-dashed line shows a spectrum calculated as the equivalent width obtained by Tafelmeyer et al. (2010) is reproduced.
Current usage metrics show cumulative count of Article Views (full-text article views including HTML views, PDF and ePub downloads, according to the available data) and Abstracts Views on Vision4Press platform.
Data correspond to usage on the plateform after 2015. The current usage metrics is available 48-96 hours after online publication and is updated daily on week days.
Initial download of the metrics may take a while.