Fig. 8.
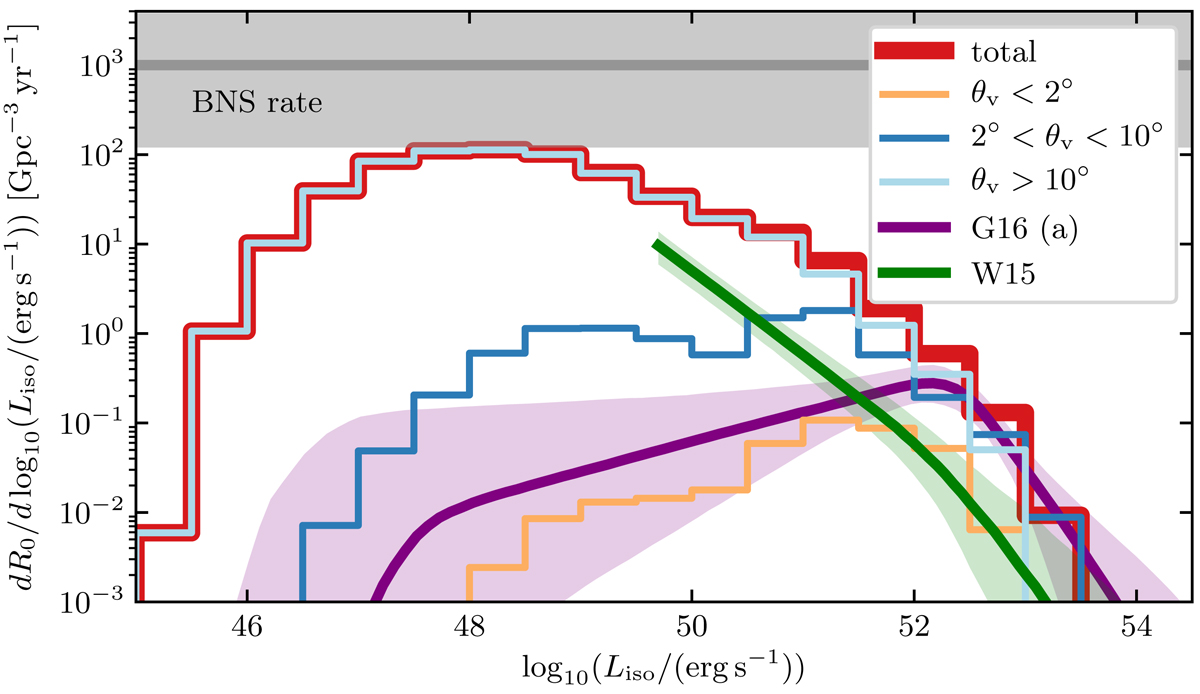
SGRB luminosity distribution of our model population (thick solid red histogram) compared to two luminosity function models based on observations (Wanderman & Piran 2015 – green solid line and shaded area – and Ghirlanda et al. 2016 – purple solid line and shaded area). Thinner histograms show the luminosity distributions of sub-classes of jets belonging to three viewing angle bins, reported in the legend. The grey line and filled horizontal band show the binary neutron star merger local rate based on gravitational wave observations (The LIGO Scientific Collaboration 2019).
Current usage metrics show cumulative count of Article Views (full-text article views including HTML views, PDF and ePub downloads, according to the available data) and Abstracts Views on Vision4Press platform.
Data correspond to usage on the plateform after 2015. The current usage metrics is available 48-96 hours after online publication and is updated daily on week days.
Initial download of the metrics may take a while.