Fig. 3.
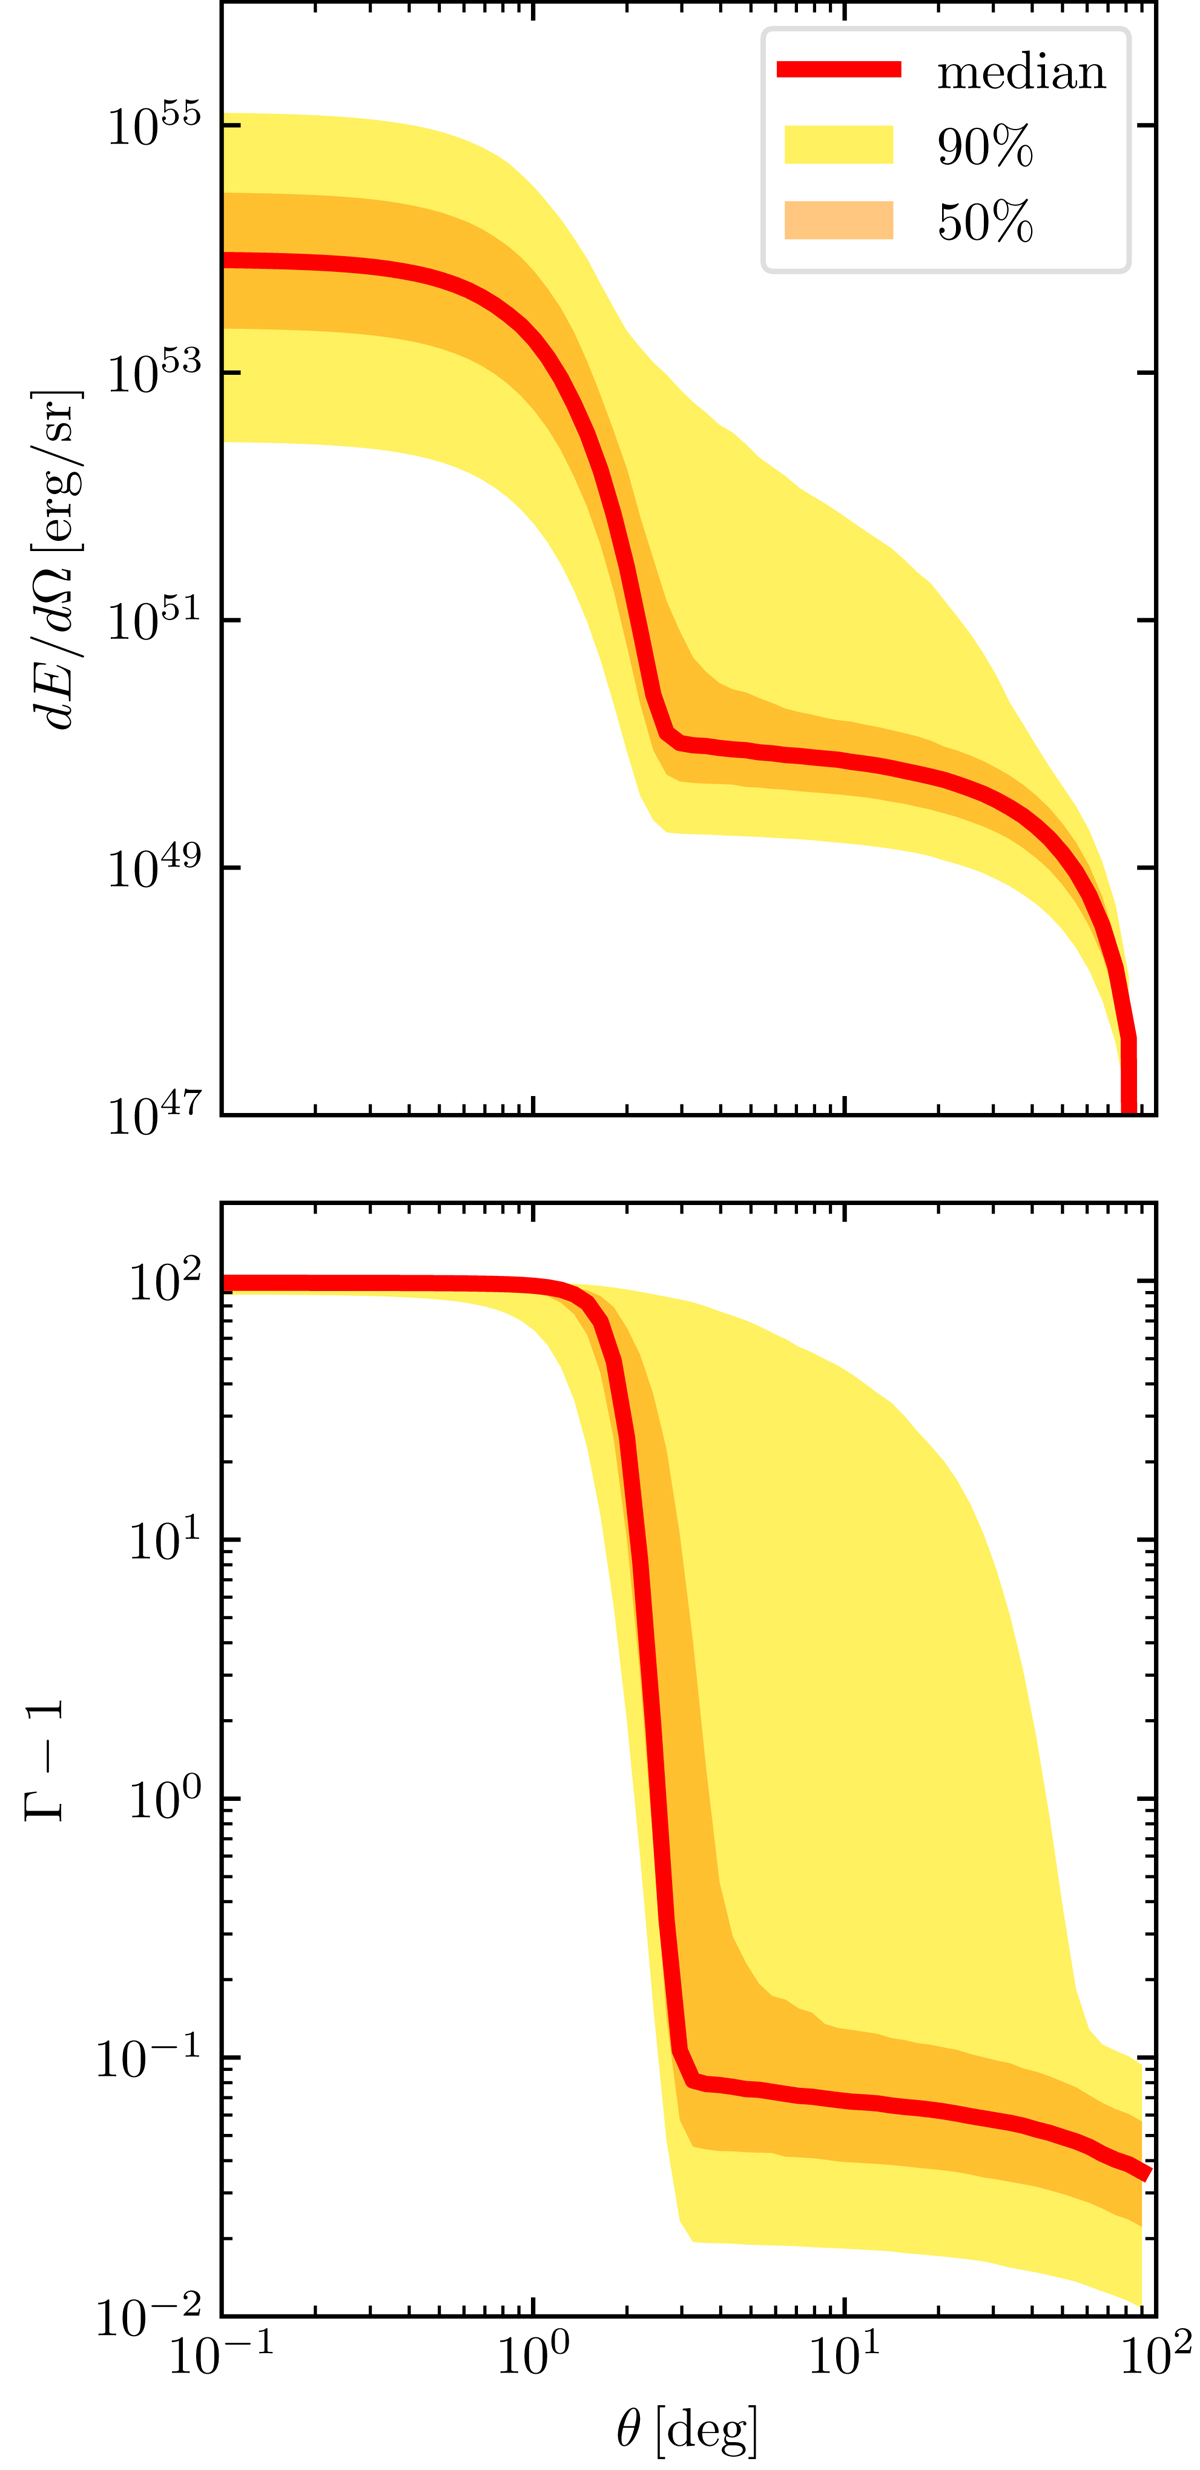
Distribution of jet structures in our LGRB population. In each panel, at each fixed angle θ, the yellow (resp. orange) filled area encloses 90% (resp. 50%) of the structures in the population, while the red line shows the median of the distribution at that angle. Top panel: energy structures (kinetic energy per unit solid angle as a function of the angle θ from the jet axis). Bottom panel: velocity structures (average Lorentz factor diminished by one, as a function of θ).
Current usage metrics show cumulative count of Article Views (full-text article views including HTML views, PDF and ePub downloads, according to the available data) and Abstracts Views on Vision4Press platform.
Data correspond to usage on the plateform after 2015. The current usage metrics is available 48-96 hours after online publication and is updated daily on week days.
Initial download of the metrics may take a while.