Fig. A.2.
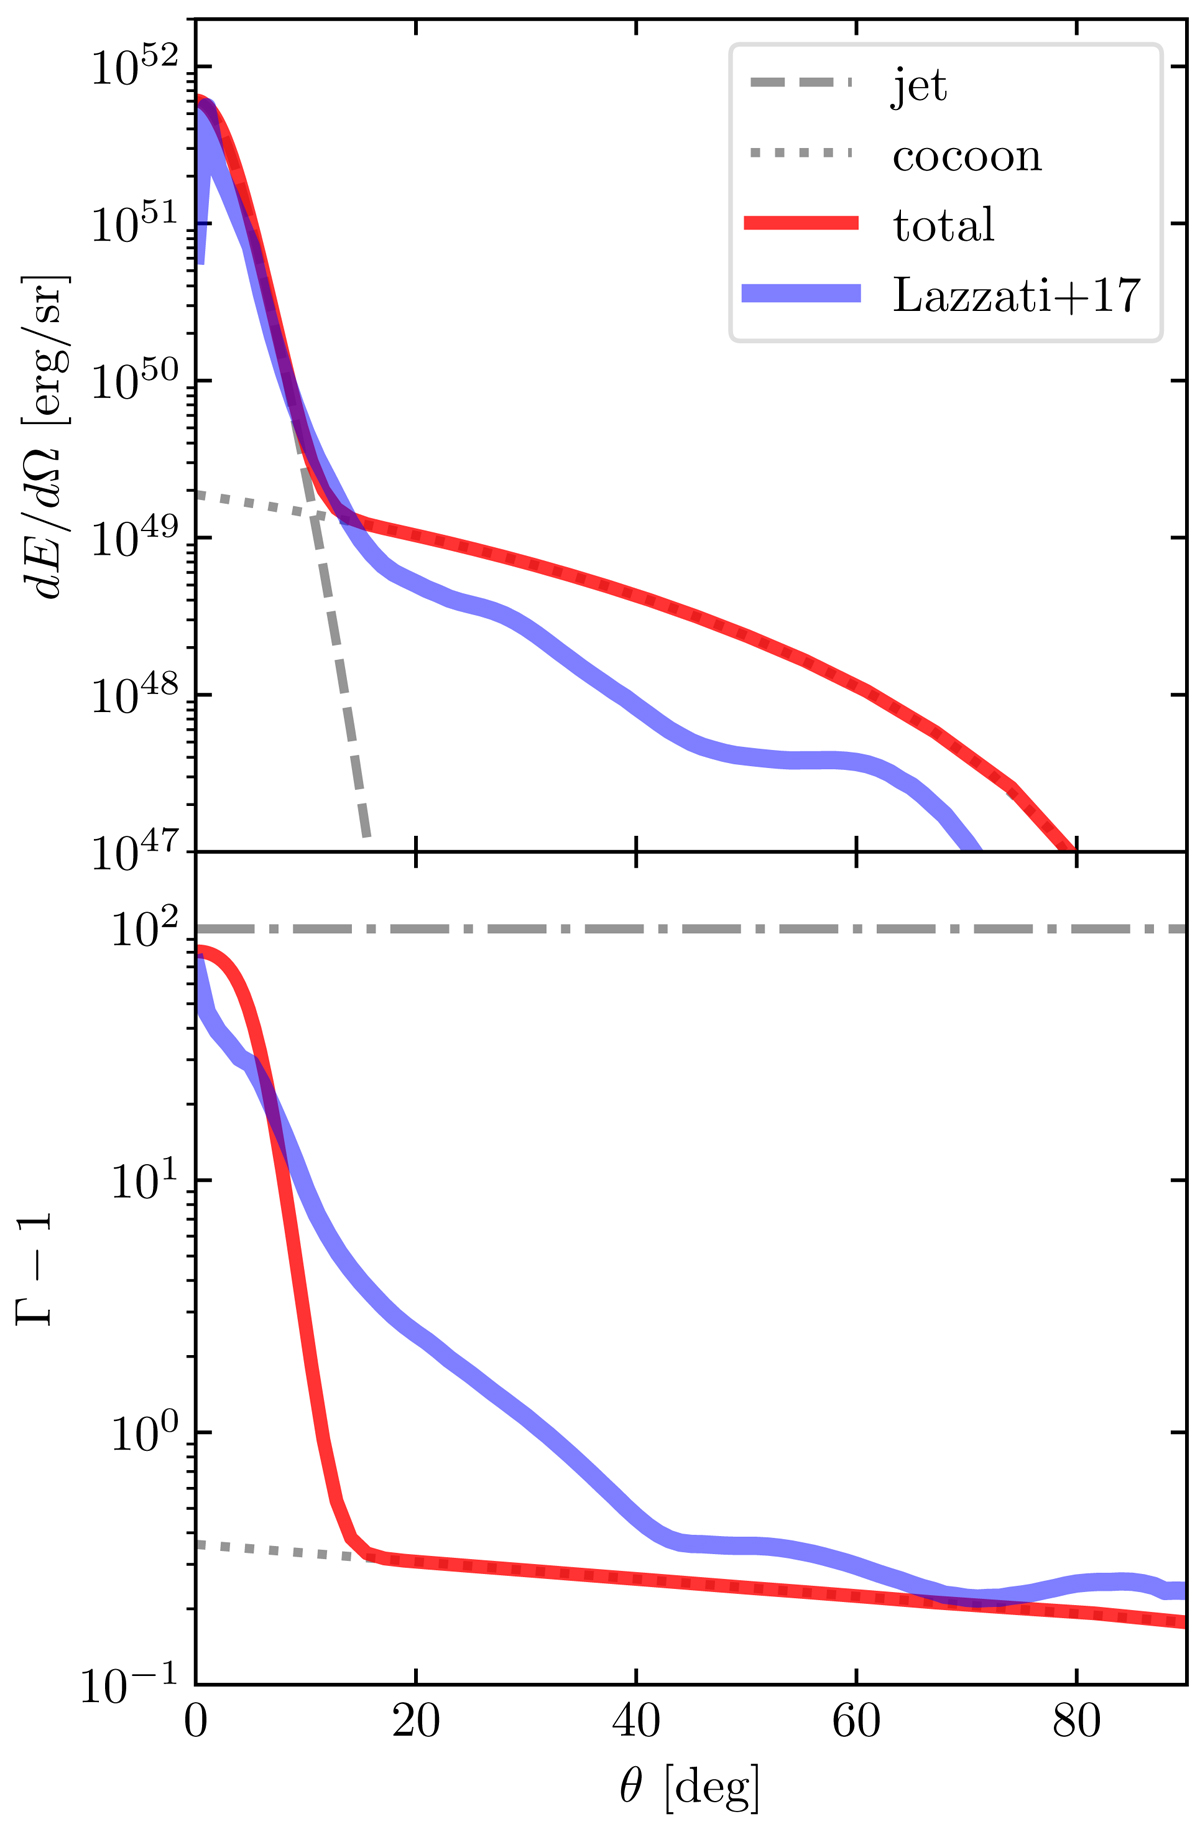
Comparison between the jet structure predicted by our model and the results of numerical simulations by Lazzati et al. (2017b). Upper panel: distribution of kinetic energy per unit solid angle, while Lower panel: average Lorentz factor diminished by one. Grey dashed and dotted lines represent respectively the jet and the cocoon as computed by our model (Sects. 3, 4 and 4.2). Red lines show the combined structure. Blue thick lines show the results of the numerical simulations (the Lorentz factor profile is given in Lazzati et al. 2018).
Current usage metrics show cumulative count of Article Views (full-text article views including HTML views, PDF and ePub downloads, according to the available data) and Abstracts Views on Vision4Press platform.
Data correspond to usage on the plateform after 2015. The current usage metrics is available 48-96 hours after online publication and is updated daily on week days.
Initial download of the metrics may take a while.