Fig. A.1.
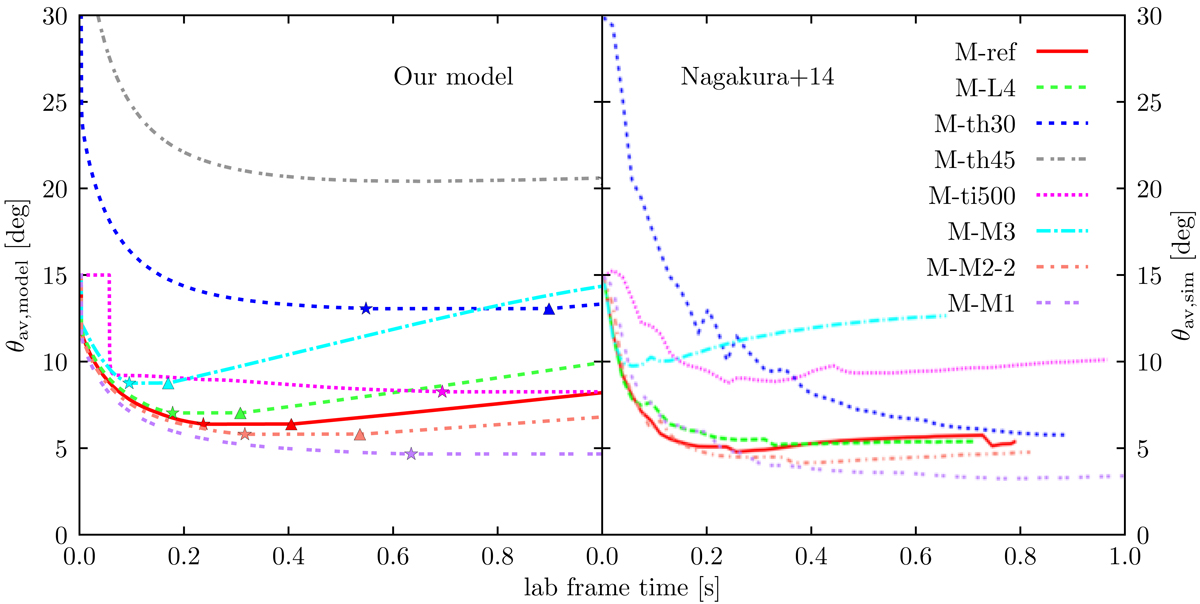
Comparison between the height-averaged opening angle evolution from the numerical simulations in Nagakura et al. 2014 (right-hand panel, adapted from their Fig. 3) and those predicted by our semi-analytical model (left-hand panel). Each line refers to a different initial configuration (see text). Stars and upward triangles in the left-hand panel mark tbo and tbo + tdelay (see Sect. 3), respectively. The evolution for configuration M-th45 is not shown in the original figure.
Current usage metrics show cumulative count of Article Views (full-text article views including HTML views, PDF and ePub downloads, according to the available data) and Abstracts Views on Vision4Press platform.
Data correspond to usage on the plateform after 2015. The current usage metrics is available 48-96 hours after online publication and is updated daily on week days.
Initial download of the metrics may take a while.