Fig. 11.
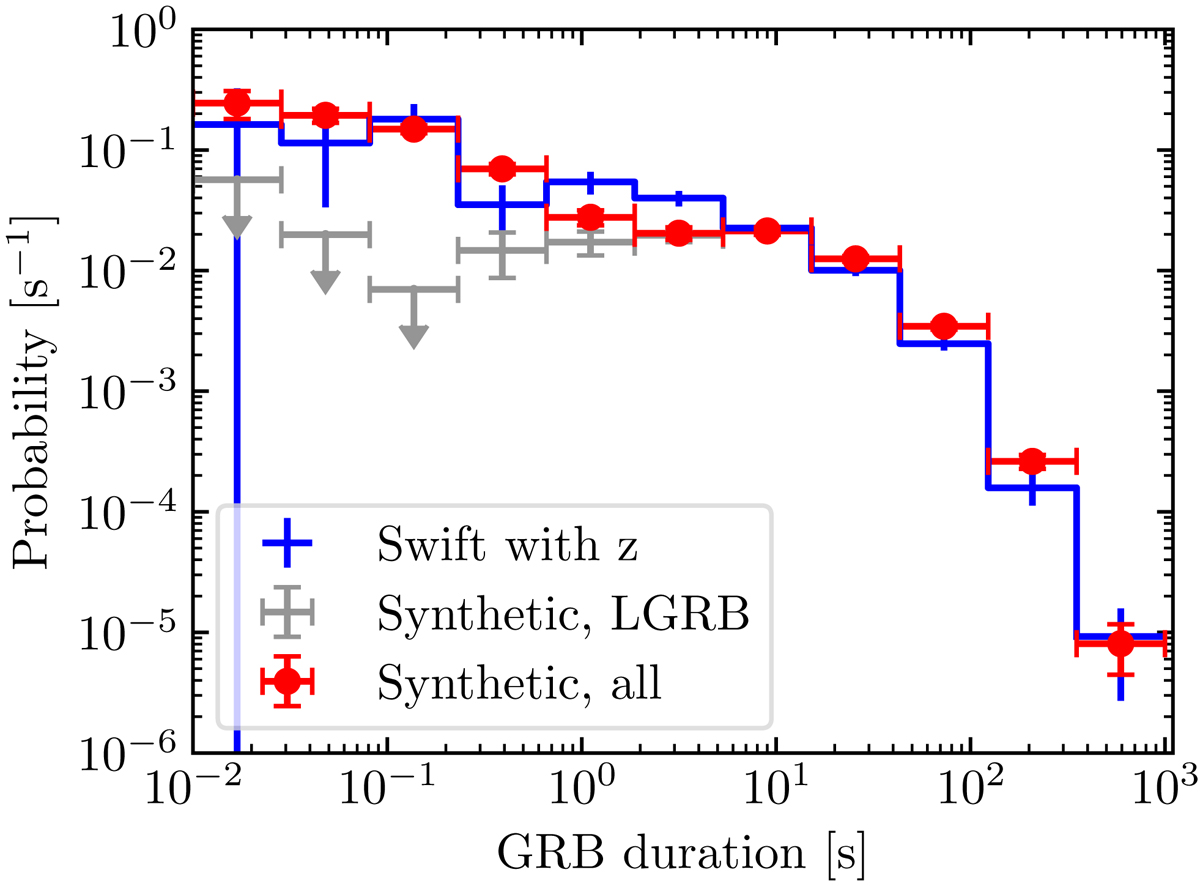
GRB duration probability distribution. The blue histogram shows the estimated probability distribution of intrinsic duration (defined as T90/(1 + z)) of Swift-detected GRBs with a measured redshift. Red points represent the corresponding distribution for our simulated populations (assuming an observed rate ratio of 13.5 between LGRB and SGRB, i.e. the same rate ratio as in the Swift sample), while the grey points show the distribution for the LGRB synthetic population alone (downward arrows are upper limits that correspond to empty bins). Vertical error bars show the Poisson uncertainty associated to each bin.
Current usage metrics show cumulative count of Article Views (full-text article views including HTML views, PDF and ePub downloads, according to the available data) and Abstracts Views on Vision4Press platform.
Data correspond to usage on the plateform after 2015. The current usage metrics is available 48-96 hours after online publication and is updated daily on week days.
Initial download of the metrics may take a while.