Fig. 9.
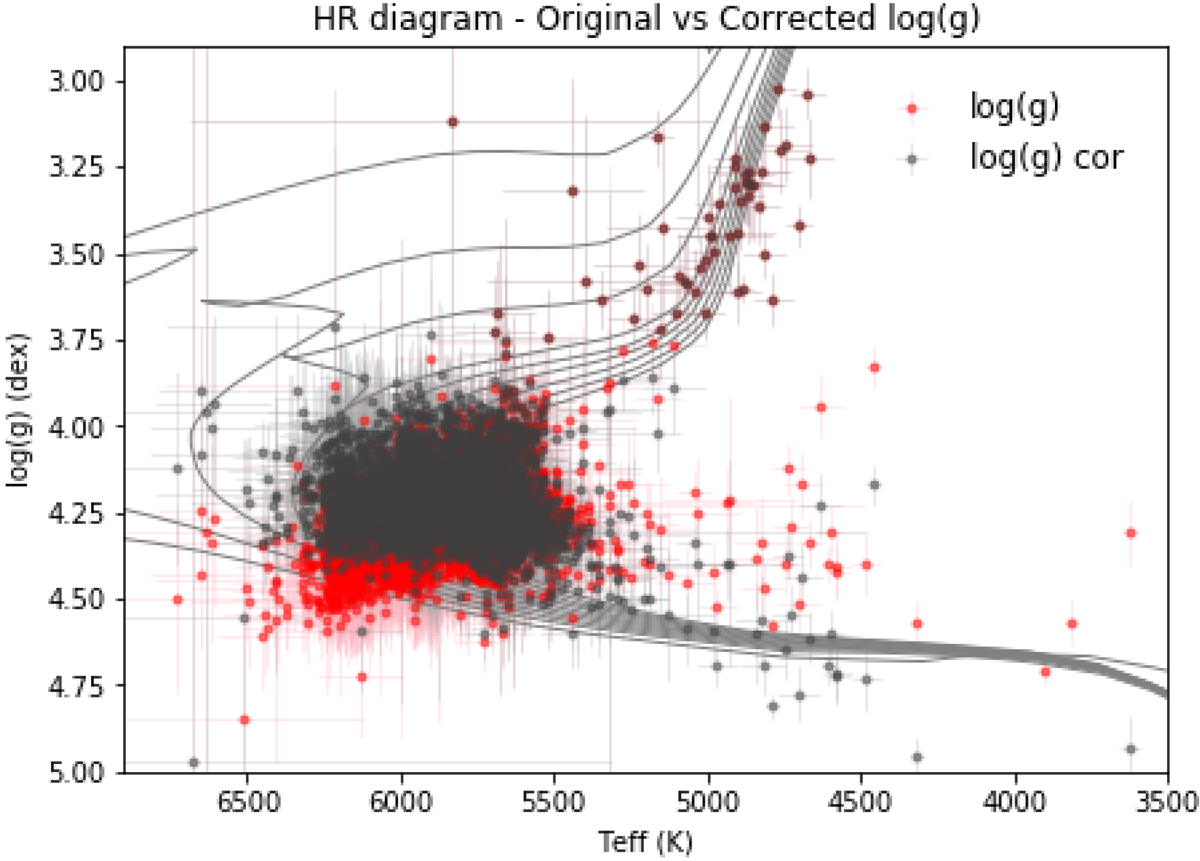
Pseudo-HR diagram of our results with the full sample, plotting both the derived log g and log g after corrections based on trigonometric log g from Delgado Mena et al. (2017) against Teff for all the stars in the sample. Worst outlier stars are excluded from this plot. PARSEC isochrones with [M/H] = 0.0 dex from Bressan et al. (2012) are overplotted.
Current usage metrics show cumulative count of Article Views (full-text article views including HTML views, PDF and ePub downloads, according to the available data) and Abstracts Views on Vision4Press platform.
Data correspond to usage on the plateform after 2015. The current usage metrics is available 48-96 hours after online publication and is updated daily on week days.
Initial download of the metrics may take a while.