Fig. 4
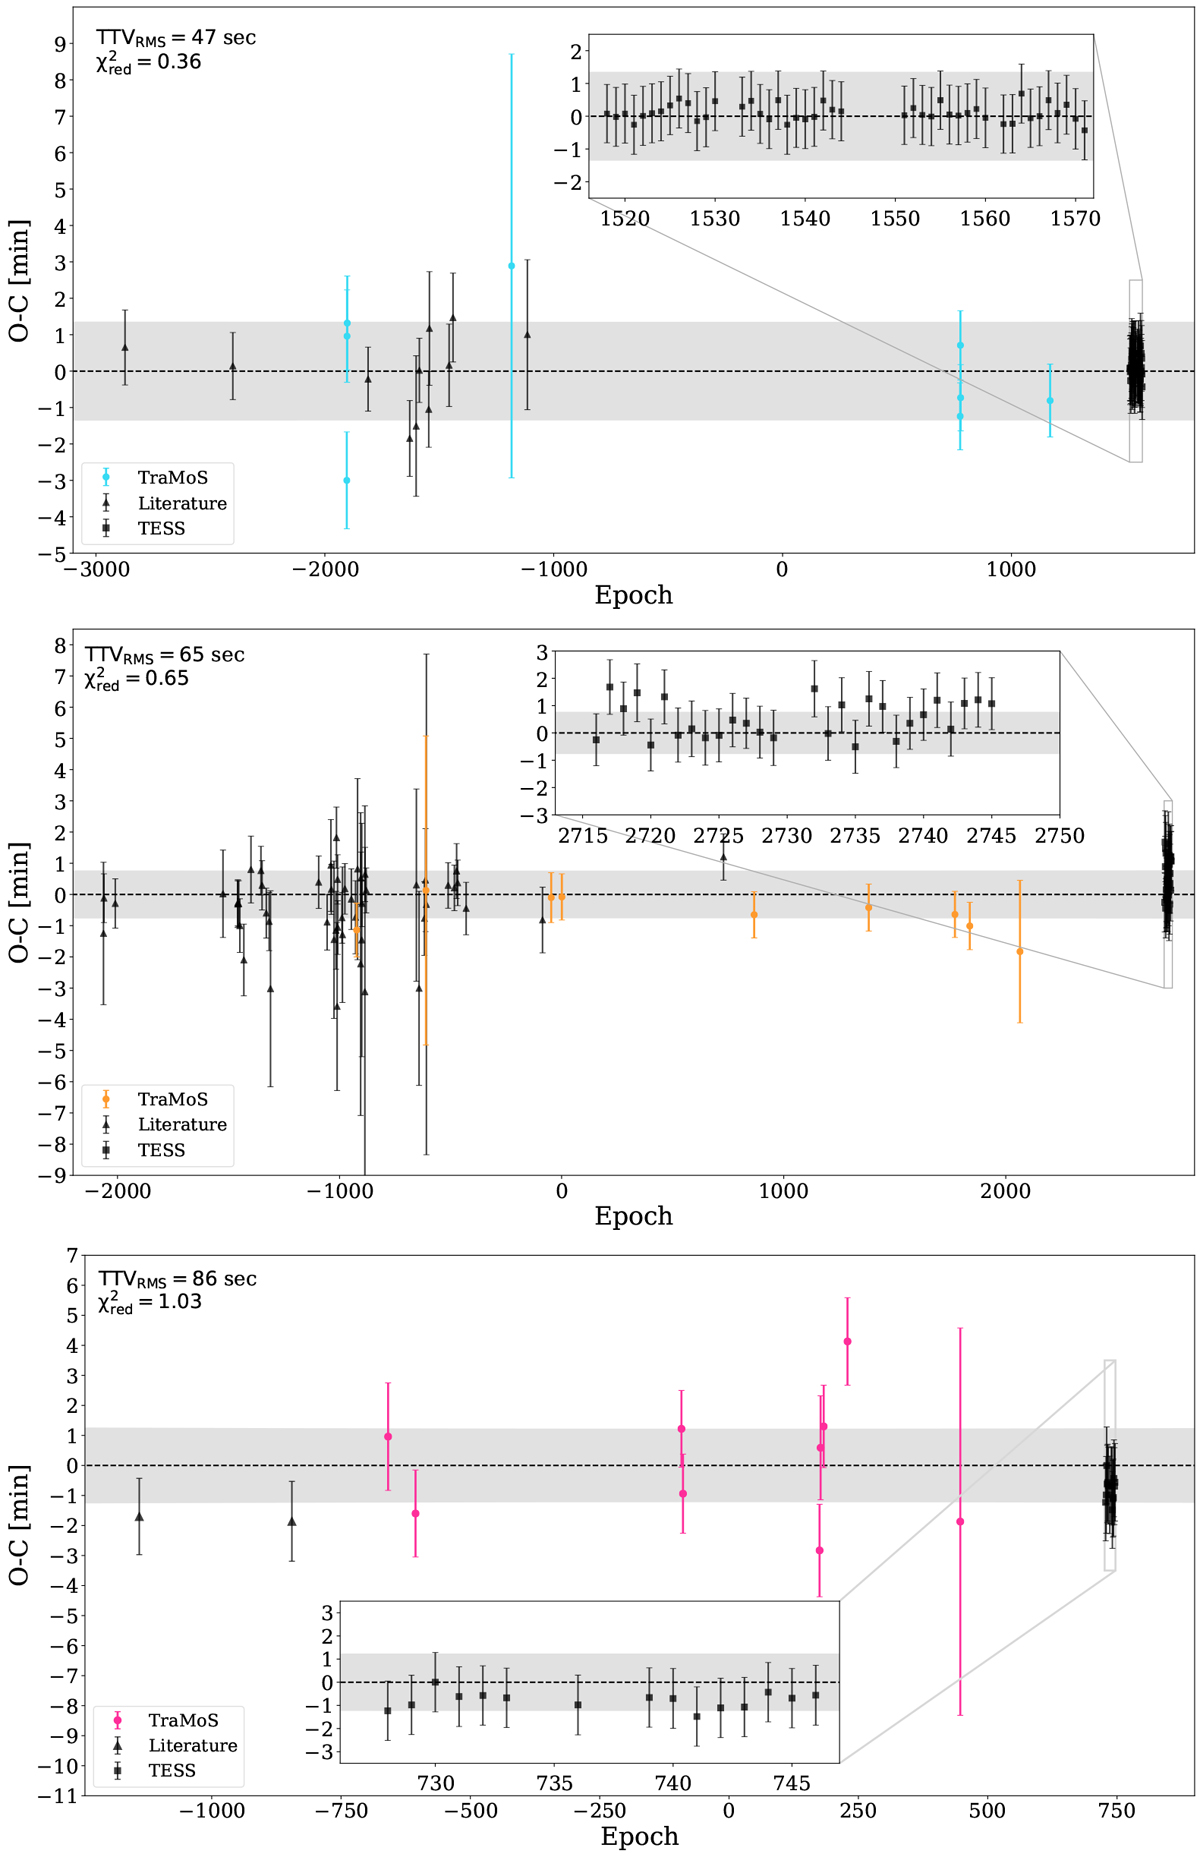
Observed minus calculated transit mid-times (TTV) for WASP-18Ab (top panel), WASP-19b (center panel), and WASP-77Ab (bottom panel). The dashed black line corresponds to the proposed linear ephemeris, i.e., zero deviation from the predicted transit mid-time (see Sect. 4.2) computed from our refined orbital period. For that, we considered 63, 88, and 26 transit times of WASP-18Ab, WASP-19b, and WASP-77Ab, respectively. The gray area corresponds to the error propagation at 1σ, where the quadratic trend appears almost horizontal. The circles in color are the TTVs from the new light curves of the TraMoS project (WASP-18Ab: light blue, WASP-19b: orange, WASP-77Ab: pink). In black are TTVs measured from different sources of transit mid-time data: the triangles are previously published transit mid-times and the squares are TESS data.The RMS scatter from the linear ephemeris are 47 s for WASP-18Ab; 65 s for WASP-19b, and 86 s for WASP-77Ab.
Current usage metrics show cumulative count of Article Views (full-text article views including HTML views, PDF and ePub downloads, according to the available data) and Abstracts Views on Vision4Press platform.
Data correspond to usage on the plateform after 2015. The current usage metrics is available 48-96 hours after online publication and is updated daily on week days.
Initial download of the metrics may take a while.