Fig. 1
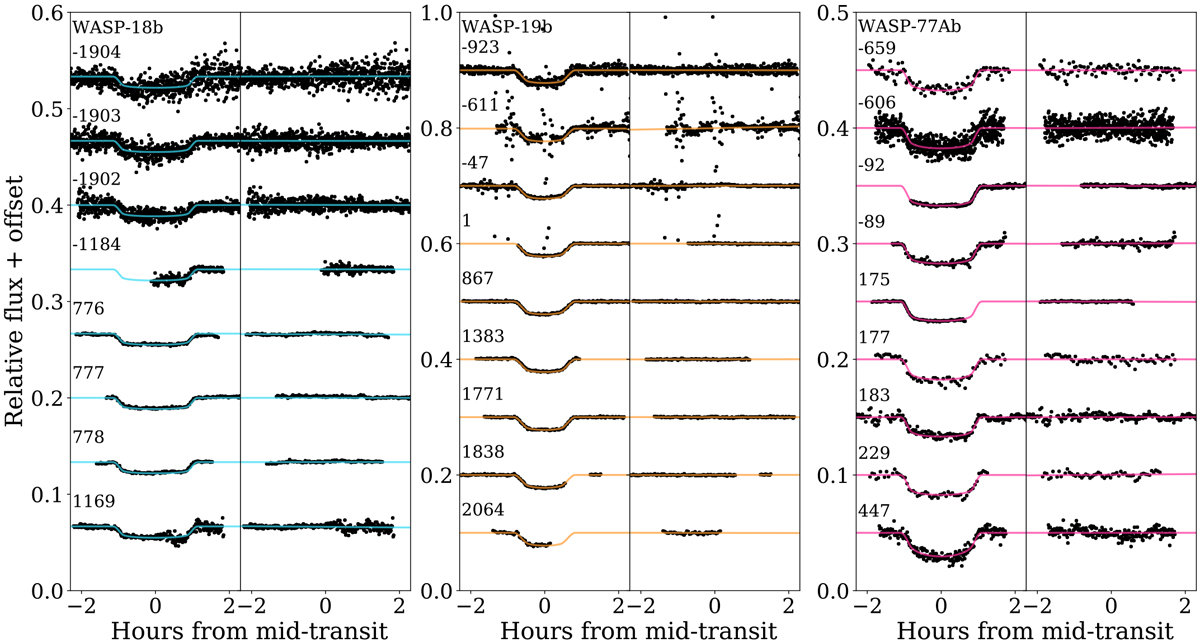
Light curves from the TraMoS project of WASP-18A, WASP19 and, WASP77A during eight, nine, and nine different transits, respectively. The best-fit model from EXOFASTv2 is shown as a light blue solid line for WASP-18Ab, orange for WASP-19b, and pink for WASP-77Ab. On the right of each panel are the corresponding residuals of the model. For clarity, bothlight curves and their residuals are offset artificially. The epoch number is indicated above each light curve. Technical information about each observation is listed in Table 1.
Current usage metrics show cumulative count of Article Views (full-text article views including HTML views, PDF and ePub downloads, according to the available data) and Abstracts Views on Vision4Press platform.
Data correspond to usage on the plateform after 2015. The current usage metrics is available 48-96 hours after online publication and is updated daily on week days.
Initial download of the metrics may take a while.