Fig. 5
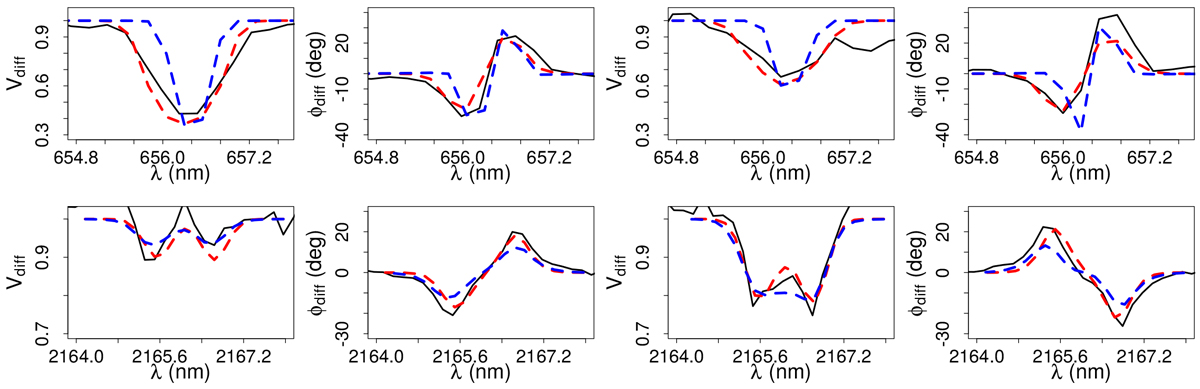
Comparison between our best-fit kinematic models (dashed red; Table 2) and two different VEGA (top panels) and AMBER (bottom panels) measurements (black line). Our best-fit HDUST model is also shown (dashed blue; Table 5; discussion in Sect. 6). δλ of the kinematic model and AMBER data is increased to 1.8 Å in order to compare them to the HDUST model (δλ fixed to 1.8 Å).
Current usage metrics show cumulative count of Article Views (full-text article views including HTML views, PDF and ePub downloads, according to the available data) and Abstracts Views on Vision4Press platform.
Data correspond to usage on the plateform after 2015. The current usage metrics is available 48-96 hours after online publication and is updated daily on week days.
Initial download of the metrics may take a while.