Open Access
Fig. 2
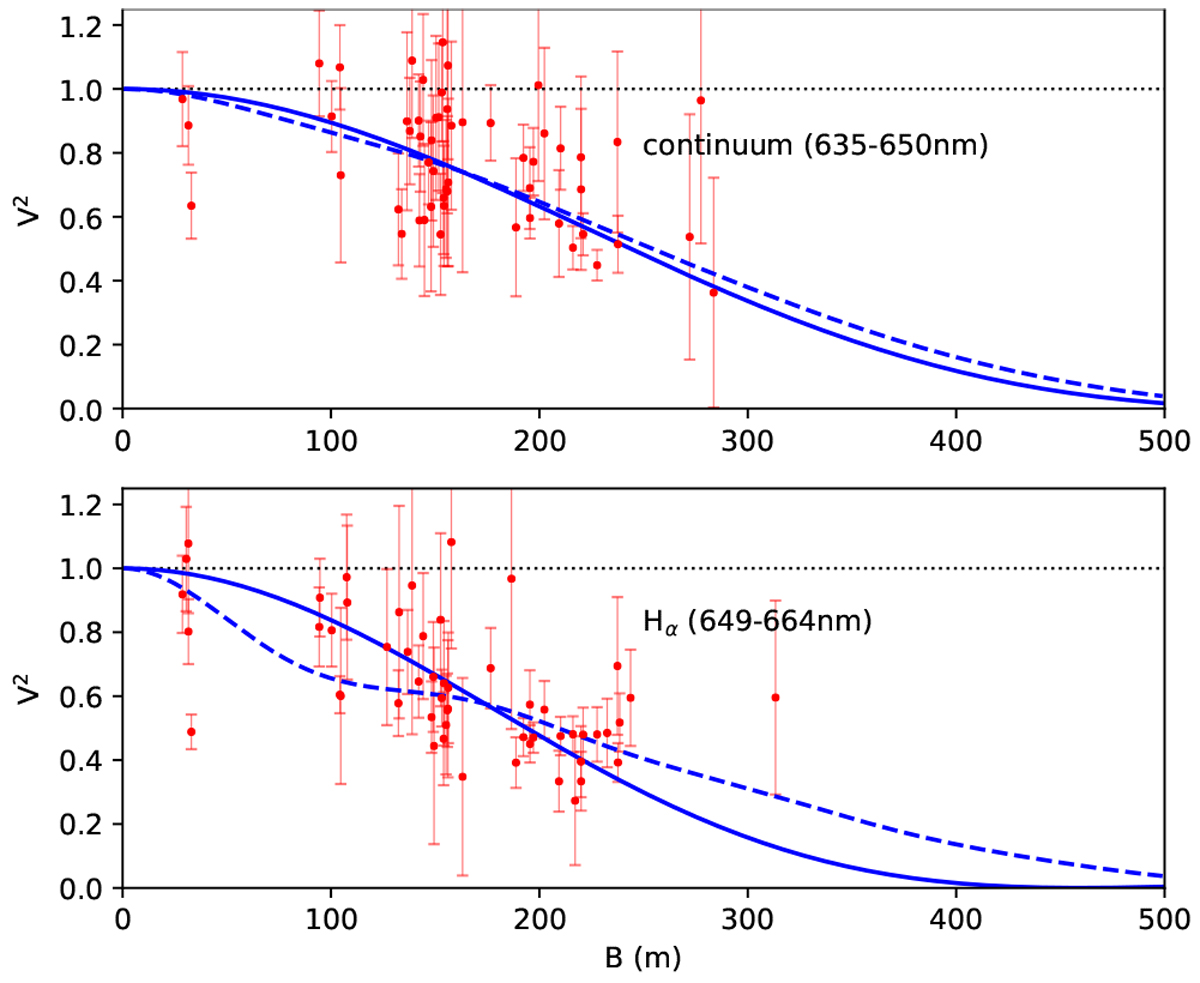
VEGA V2 measurements in the close-by continuum band (top) and in the Hα band (bottom) are shown in red points. Our best-fit models consisting of one (solid line) and two (dashed line) uniform disks are overplotted in blue. See Table 1 and text for discussion.
Current usage metrics show cumulative count of Article Views (full-text article views including HTML views, PDF and ePub downloads, according to the available data) and Abstracts Views on Vision4Press platform.
Data correspond to usage on the plateform after 2015. The current usage metrics is available 48-96 hours after online publication and is updated daily on week days.
Initial download of the metrics may take a while.