Fig. 11
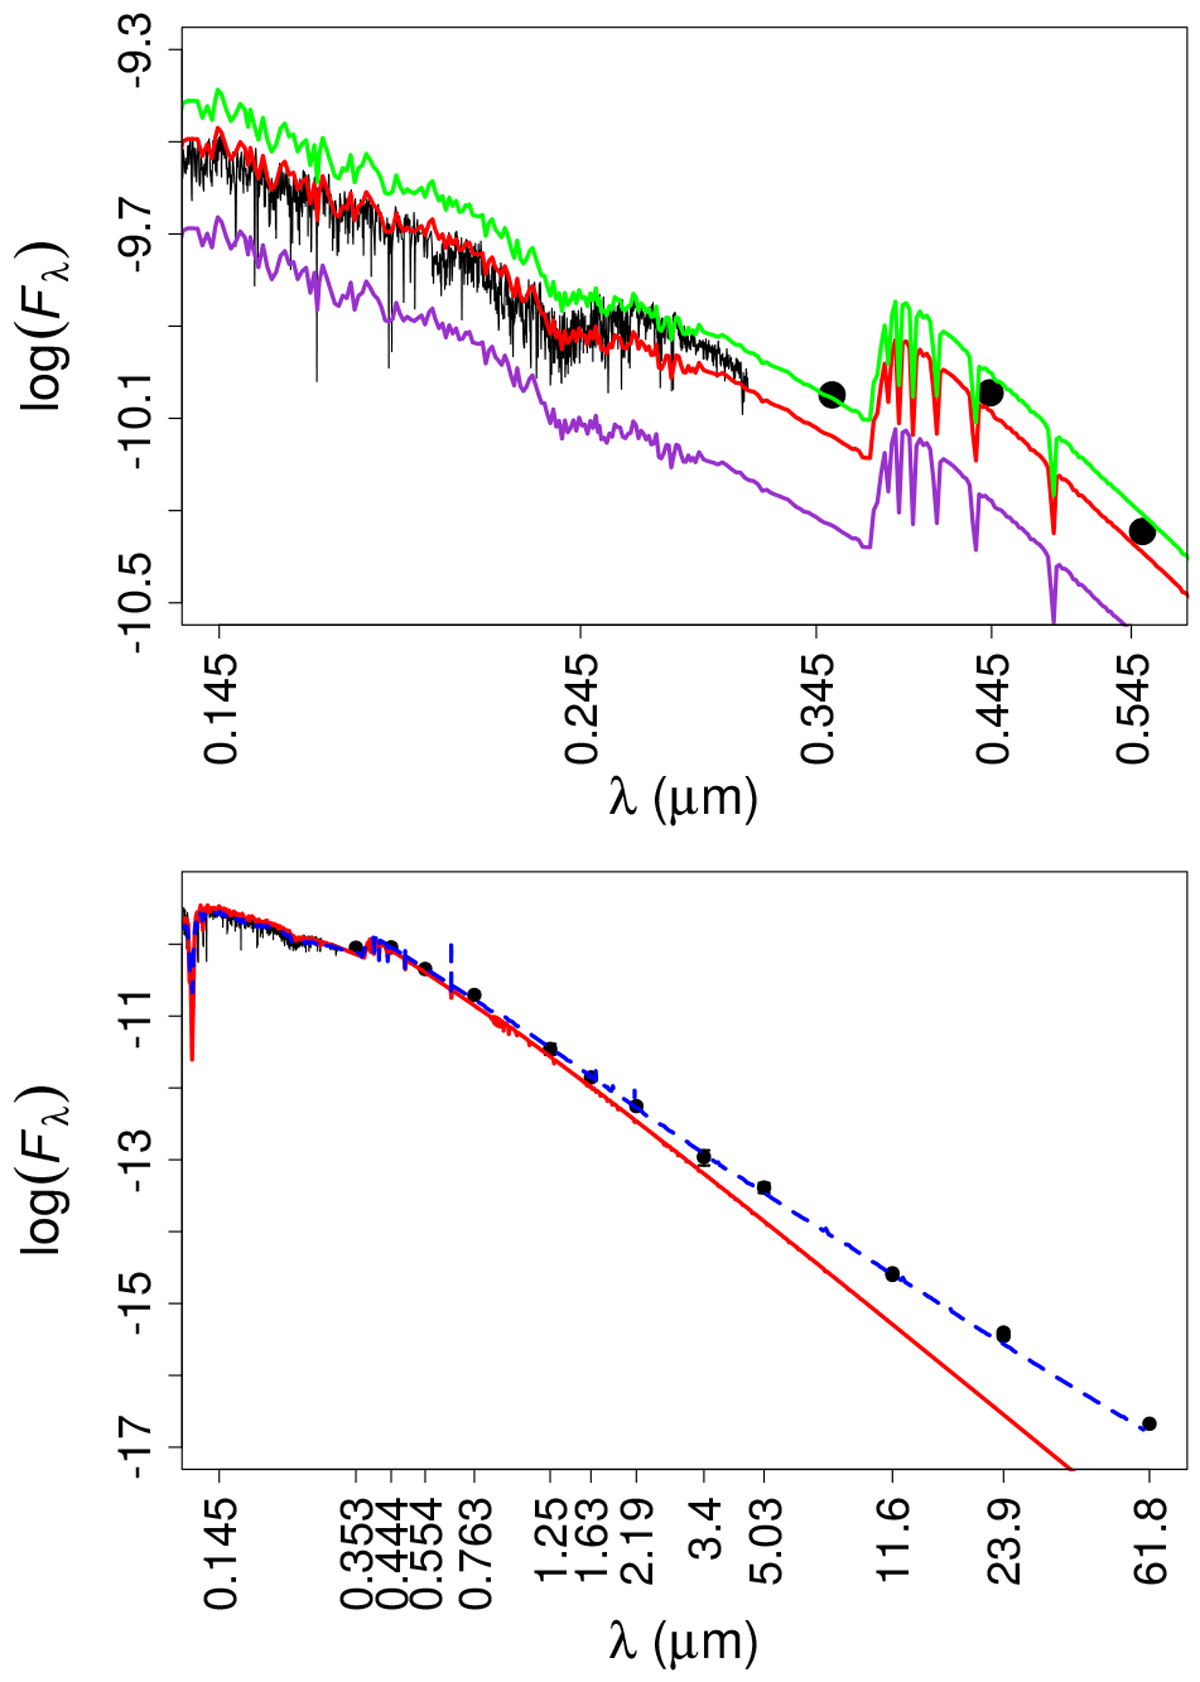
Comparison between the observed o Aquarii and model SEDs from the ultraviolet to the far-infrared region. Flux unit is in erg cm−2 s−1 Å−1 and wavelength is shown in logarithmic scale. IUE/SWP and IUE/LWP spectra are shown in black line and photometric data in black points. Top panel: purely photospheric models (color lines) with variation in the stellar radius (no inclusion of geometrical oblateness): R⋆ = 3.2 R⊙ (orchid), 4.0 R⊙ (red), and 4.4 R⊙ (green). Bottom panel: photospheric model with 4.0 R⊙ (red) and our best-fit HDUST model from fitting all the interferometric data (dashed blue line; Table 5). Note that the UBV-bands are better reproduced with R⋆ = 4.0–4.4 R⊙. Our best HDUST model reproduces the observed IR excess due to the circumstellar disk well.
Current usage metrics show cumulative count of Article Views (full-text article views including HTML views, PDF and ePub downloads, according to the available data) and Abstracts Views on Vision4Press platform.
Data correspond to usage on the plateform after 2015. The current usage metrics is available 48-96 hours after online publication and is updated daily on week days.
Initial download of the metrics may take a while.