Fig. 5
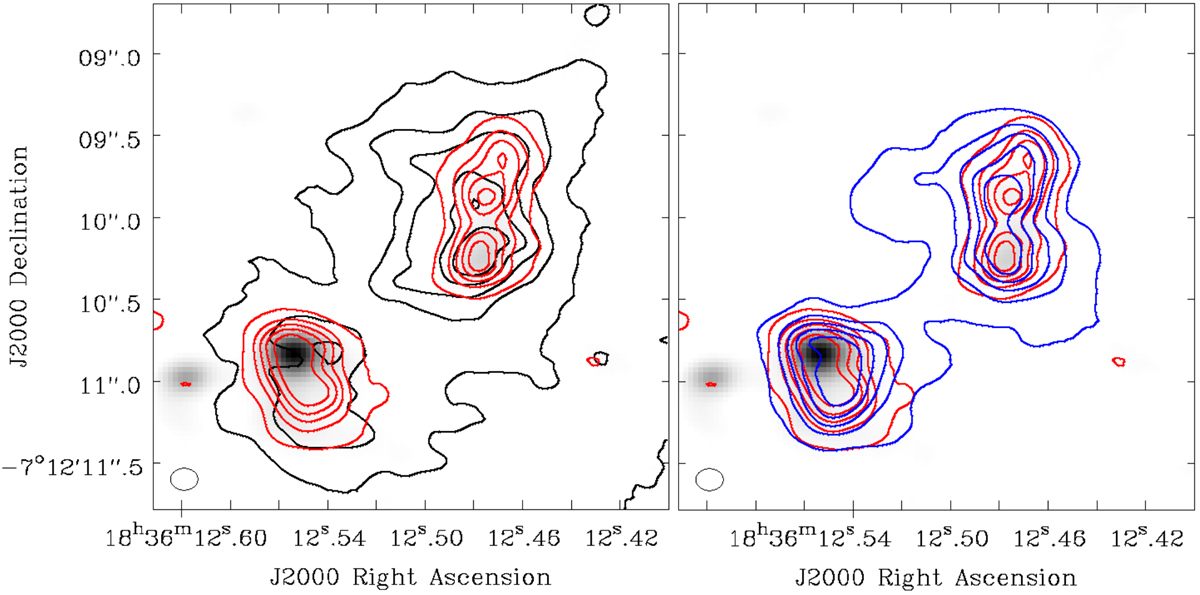
G24 zeroth moment maps (contours) overlaid on the dust continuum (grayscale). Left: the black contours show the H2CO (3) transition (Eup = 68.1 K) from 5σ to a peak of 0.674 Jy beam−1 km s−1 (contour levels 0.03, 0.16, 0.29, 0.42, and 0.55 Jy beam−1 km s−1). The red contours show NH2CHO (2) emission (Eup = 78.9 K) from 5σ to 0.512 Jy beam−1 km s−1 (contour levels 0.026, 0.123, 0.220, 0.318, and 0.415 Jy beam−1 km s−1). Right: the blue contours show the extent of the HNCO (1) emission (Eup = 58.0 K) from 5σ to 0.738 Jy beam−1 km s−1 (contour levels 0.031, 0.172, 0.314, 0.455, and 0.597 Jy beam−1 km s−1) with the red contours showing NH2CHO (as in the left frame).
Current usage metrics show cumulative count of Article Views (full-text article views including HTML views, PDF and ePub downloads, according to the available data) and Abstracts Views on Vision4Press platform.
Data correspond to usage on the plateform after 2015. The current usage metrics is available 48-96 hours after online publication and is updated daily on week days.
Initial download of the metrics may take a while.