Fig. 1
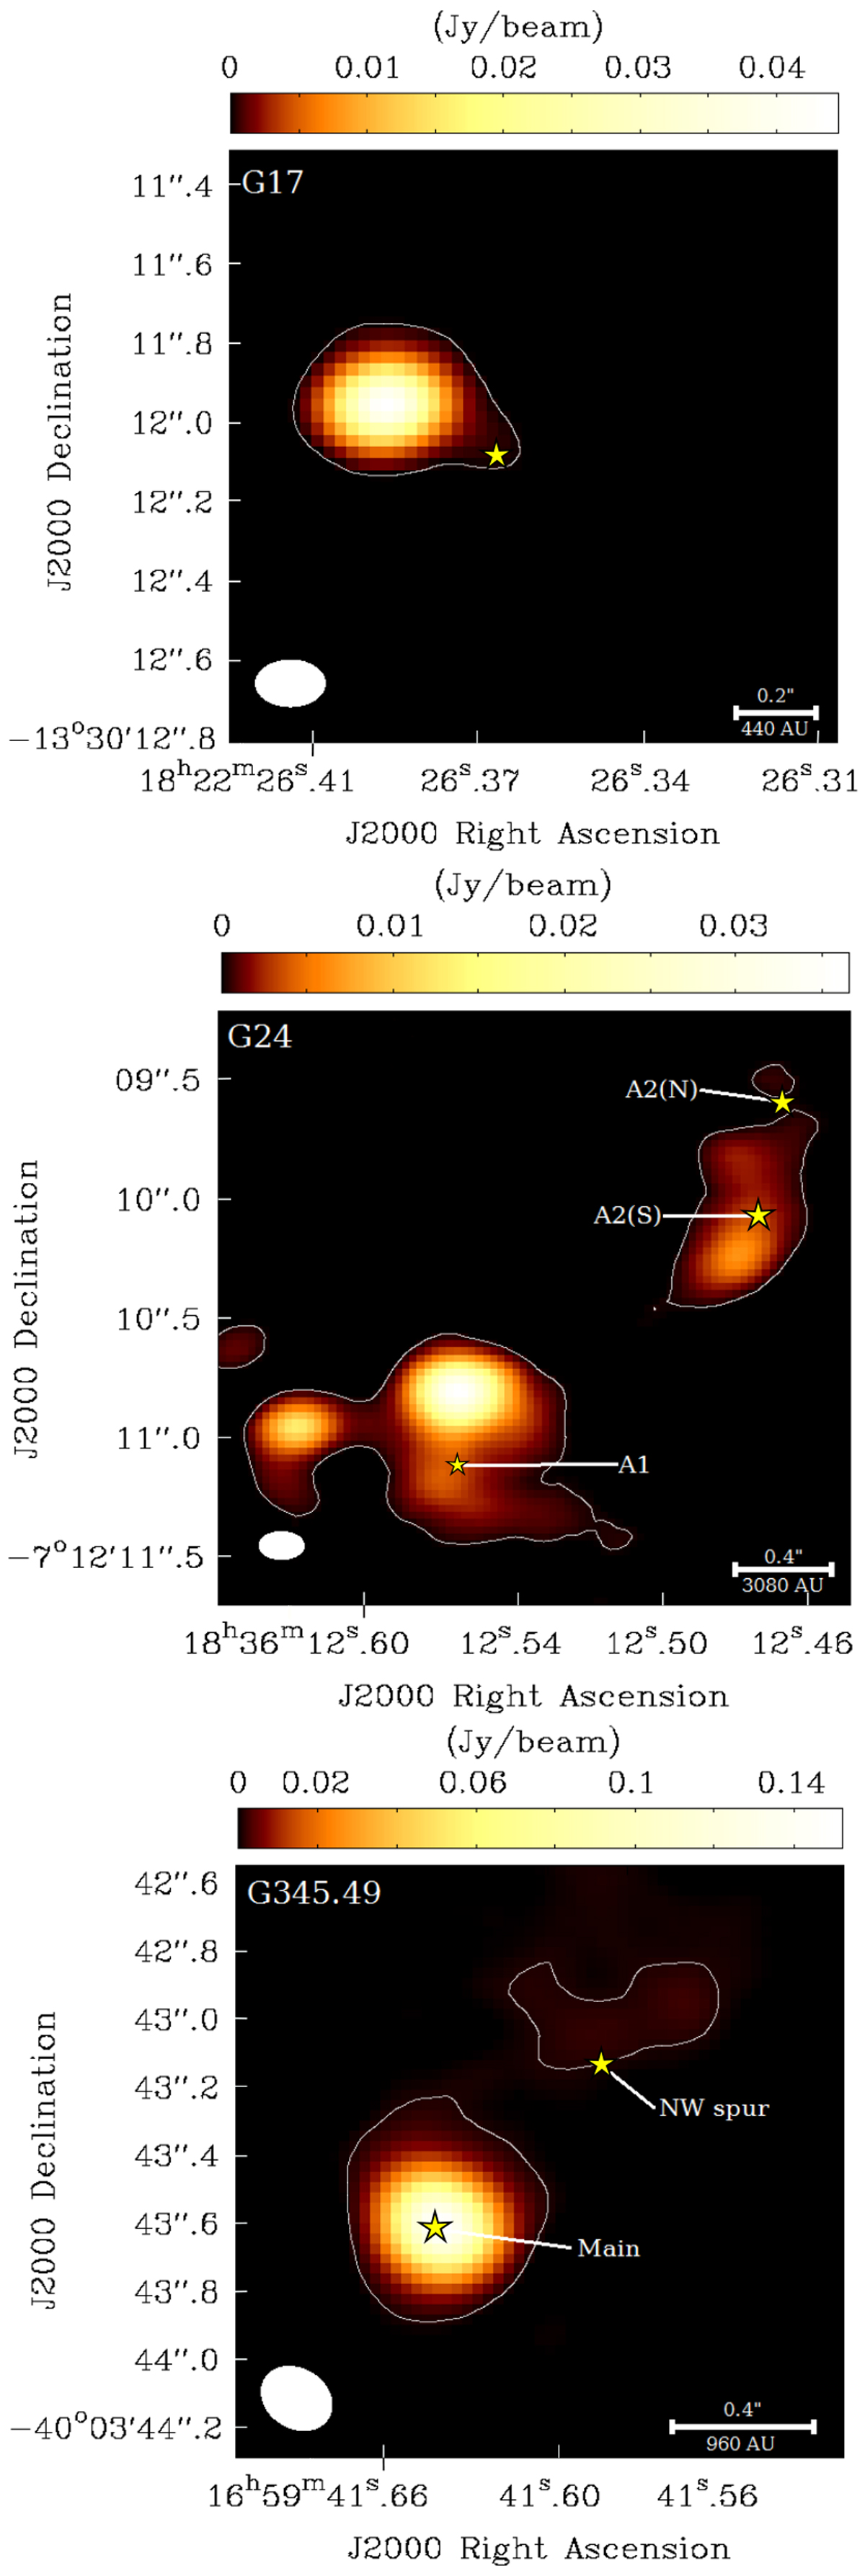
Images of the 218 GHz continuum emission from Cycle 2 ALMA observations of our three regions focusing on the regions where NH2CHO emission is observed. The color scale indicates the continuum flux as detailed in the color bar above each map. The white contour shows the 5σ contour levels for each panel: 1.5, 2.5, and 2.5 mJy beam−1. The starsmark each of the spectral extraction points (coinciding with the zeroth moment peaks of NH2CHO emission) and subsources are labeled.
Current usage metrics show cumulative count of Article Views (full-text article views including HTML views, PDF and ePub downloads, according to the available data) and Abstracts Views on Vision4Press platform.
Data correspond to usage on the plateform after 2015. The current usage metrics is available 48-96 hours after online publication and is updated daily on week days.
Initial download of the metrics may take a while.