Fig. 8
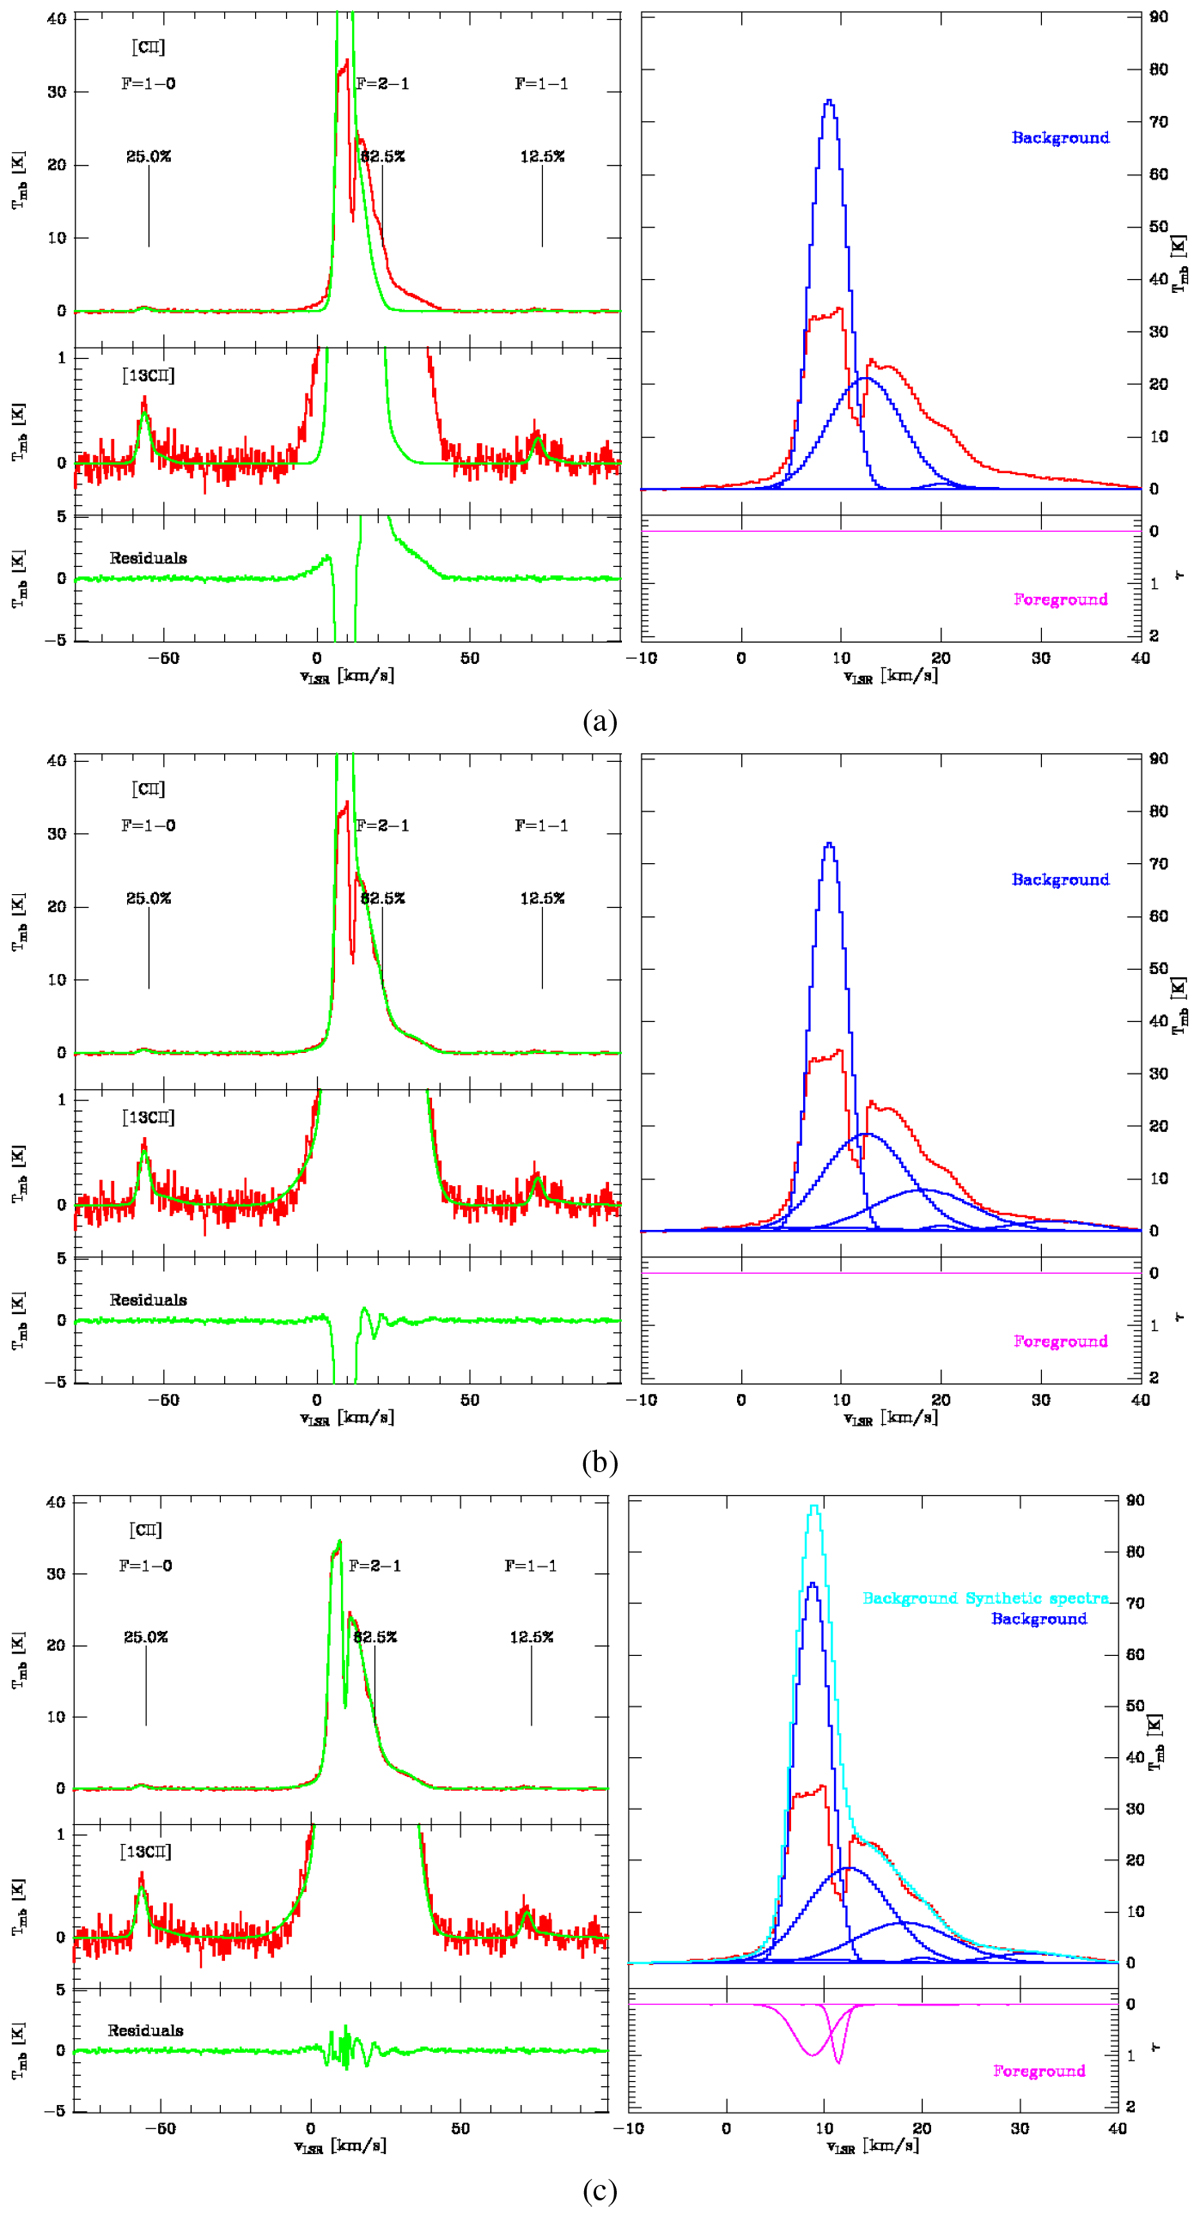
Demonstration of the multi-component fitting procedure, taking the Mon R2 Pos 1 spectrum as an example. Each plot (a–c) is structured in the same way. Left top: fitted model in green and the observed spectrum in red. Middle left: zoom-in vertically of the fitted model and the observed spectra to better show the [13C II] satellites. Left bottom: residual between the observed spectra and the model. Right top: fitted background emission component in blue, the resulting background emission model from the addition of all the components in cyan and the observed spectrum in red. Right bottom: optical depth of each absorbing foreground component (inverted scale) in pink. a: fitting of the [13C II] emission, masking the velocity range of the [12C II] emission. b: fitting of the remaining [12C II] background emission. c: fitting of the foreground absorbing components.
Current usage metrics show cumulative count of Article Views (full-text article views including HTML views, PDF and ePub downloads, according to the available data) and Abstracts Views on Vision4Press platform.
Data correspond to usage on the plateform after 2015. The current usage metrics is available 48-96 hours after online publication and is updated daily on week days.
Initial download of the metrics may take a while.