Fig. D.3
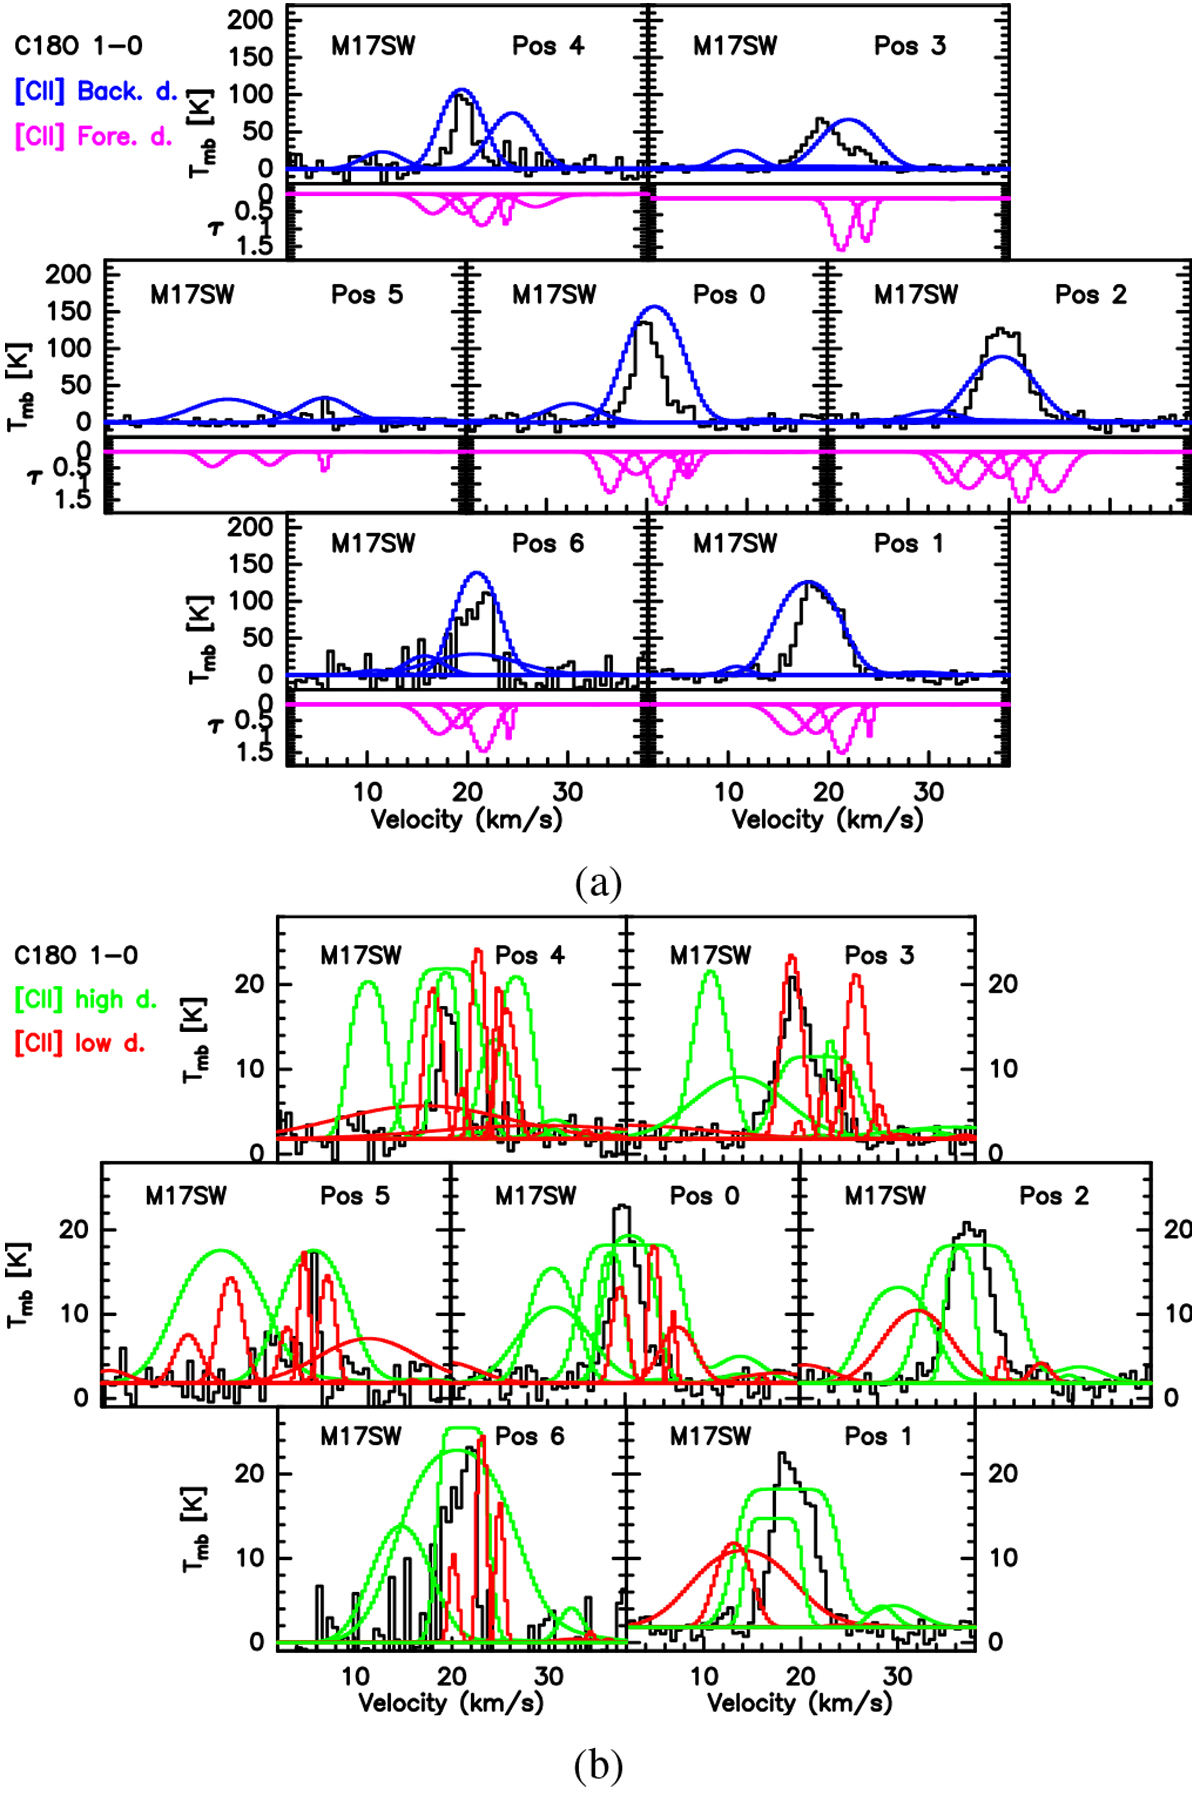
M17 SW mosaics of the seven positions observed by upGREAT. (a) Comparison between C18O J = 1–0 and the [12C II] Gaussian components from the double layer model. Scaled-up C18O observationsare in black, [12C II] background components are in blue and [12C II] foreground optical depth components are in pink. (b) Comparison between C18O J = 1–0 and the [12C II] Gaussian components from the single layer model. Scaled-up C18O observationsare in black, [12C II] high density low temperature components are in green ([C II] high d.) and [12C II] low density high temperature components are in red ([C II] low d.).
Current usage metrics show cumulative count of Article Views (full-text article views including HTML views, PDF and ePub downloads, according to the available data) and Abstracts Views on Vision4Press platform.
Data correspond to usage on the plateform after 2015. The current usage metrics is available 48-96 hours after online publication and is updated daily on week days.
Initial download of the metrics may take a while.