Fig. 3
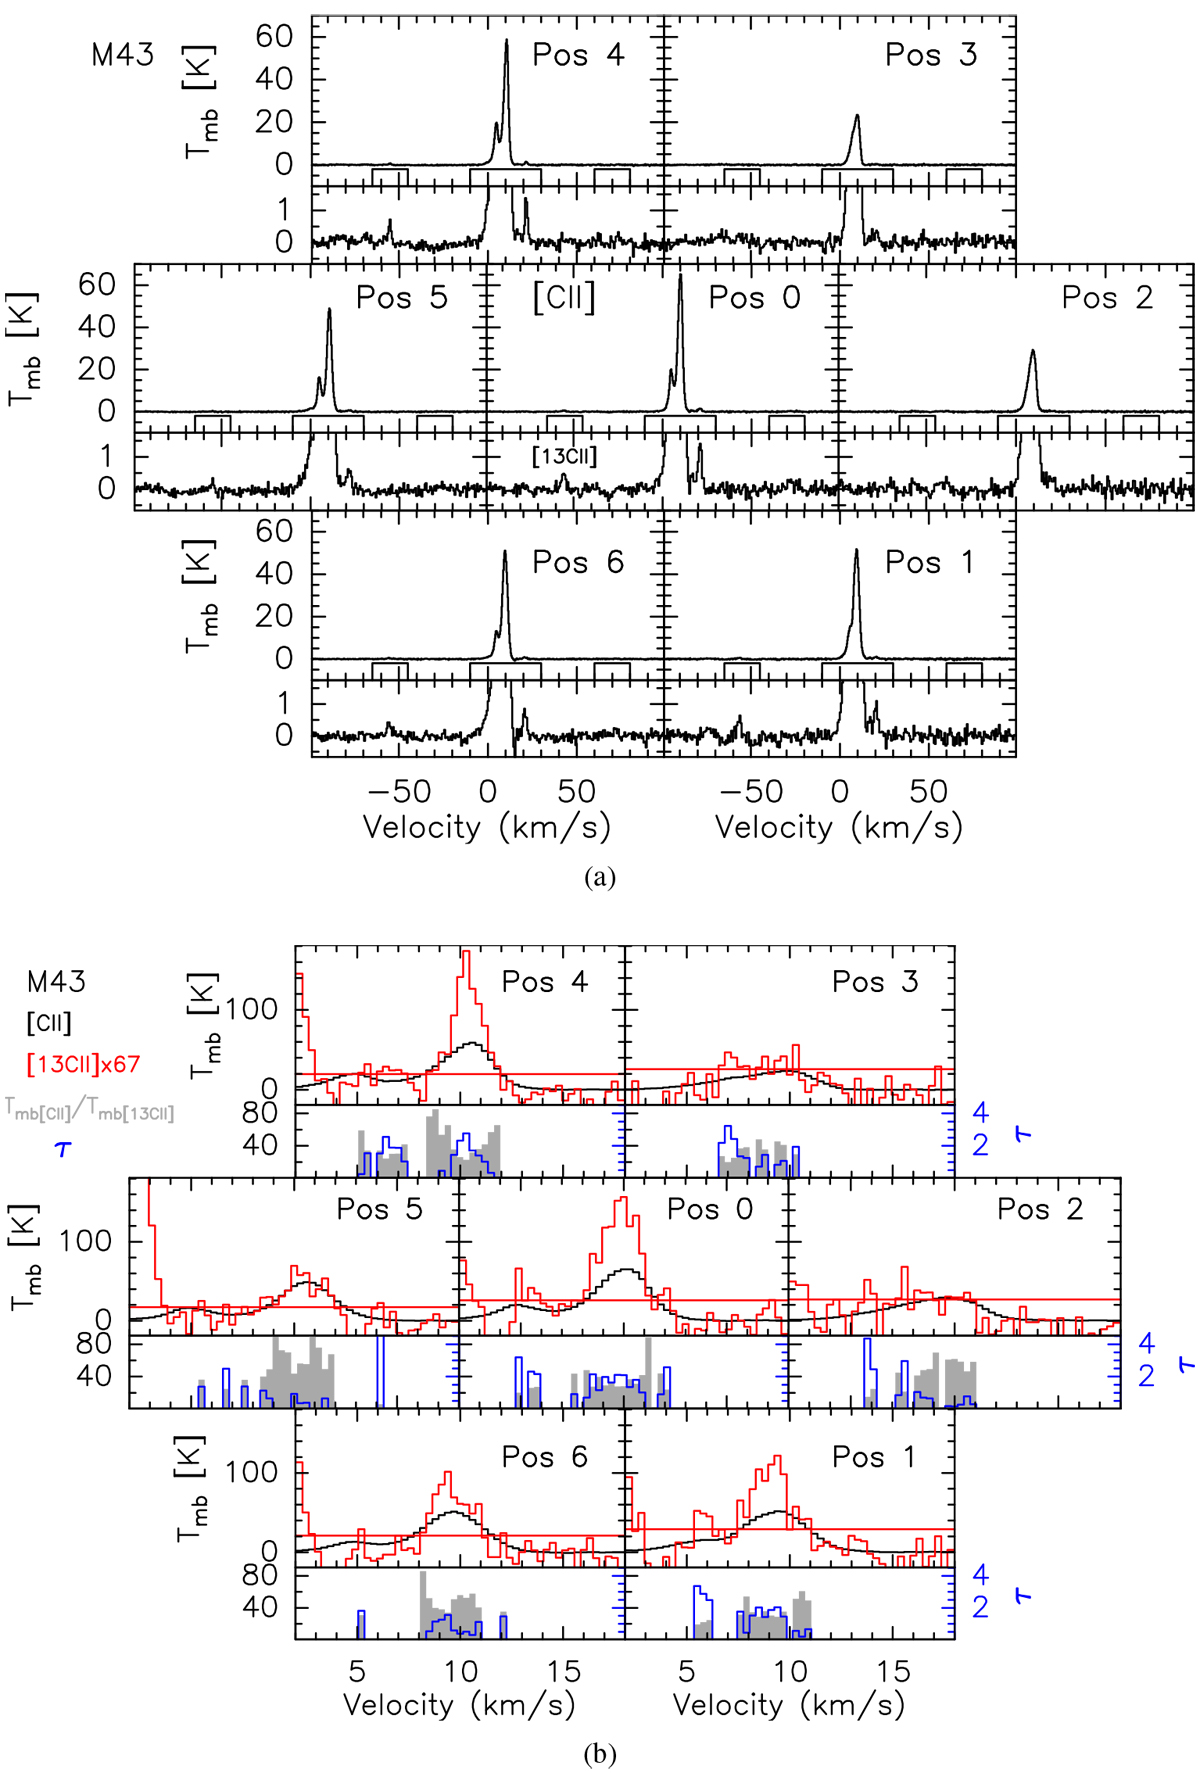
(a) Mosaic observed in M43. For each position, the [12C II] line profileis shown in the top box. Below the spectra, we show the windows for the base line subtraction (−65,−45) (−10,30) (60,80) km s−1. The bottom box shows a zoom to the [13C II] satellites. (b) M43 mosaicof the seven positions observed by upGREAT. For each position, we show in the top panel a comparison between [12C II] (in black) and [13C II] (in red), the latter averaged over the hyperfine satellites and scaled-up by the assumed value of α+ = 67. The red line corresponds to 1.5 σ scaled-up by α+. Bottom panels: for all observation above 1.5 σ, the [12C II]/[13C II] intensity ratio per velocity bin (in gray) and the optical depth from the zeroth-order analysis (blue).
Current usage metrics show cumulative count of Article Views (full-text article views including HTML views, PDF and ePub downloads, according to the available data) and Abstracts Views on Vision4Press platform.
Data correspond to usage on the plateform after 2015. The current usage metrics is available 48-96 hours after online publication and is updated daily on week days.
Initial download of the metrics may take a while.