Fig. C.2
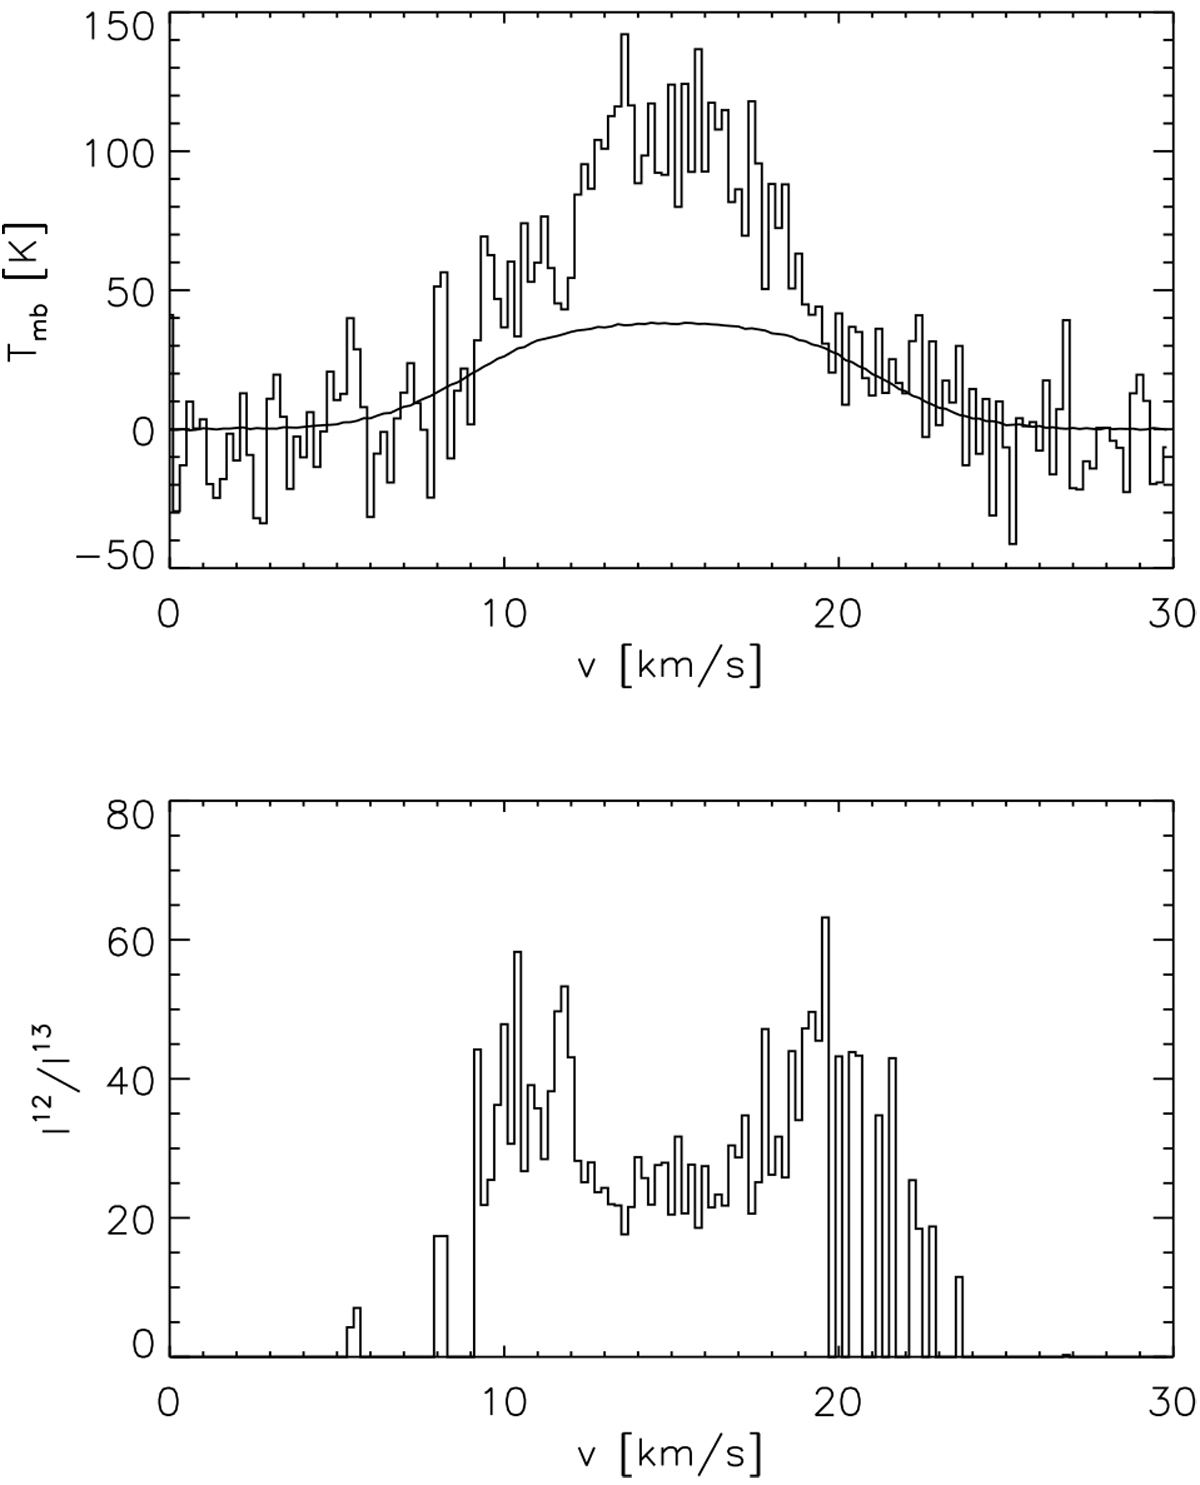
Comparison of the simulated line profiles of [12C II] and [13C II] (top) and the line ratio (bottom) equivalent to the plots in Figs. 3b–6b. An intrinsic abundance ratio α+ = 67 is assumed. The underlying optical depth profile is Gaussian with a width Δv = 12.5 km s−1 and a peak value of τ12 = 3. Similar to the observations of Mon R2, noise with σ = 0.25 K was added and the line ratio is only measured above 1.5σ.
Current usage metrics show cumulative count of Article Views (full-text article views including HTML views, PDF and ePub downloads, according to the available data) and Abstracts Views on Vision4Press platform.
Data correspond to usage on the plateform after 2015. The current usage metrics is available 48-96 hours after online publication and is updated daily on week days.
Initial download of the metrics may take a while.