Fig. 1
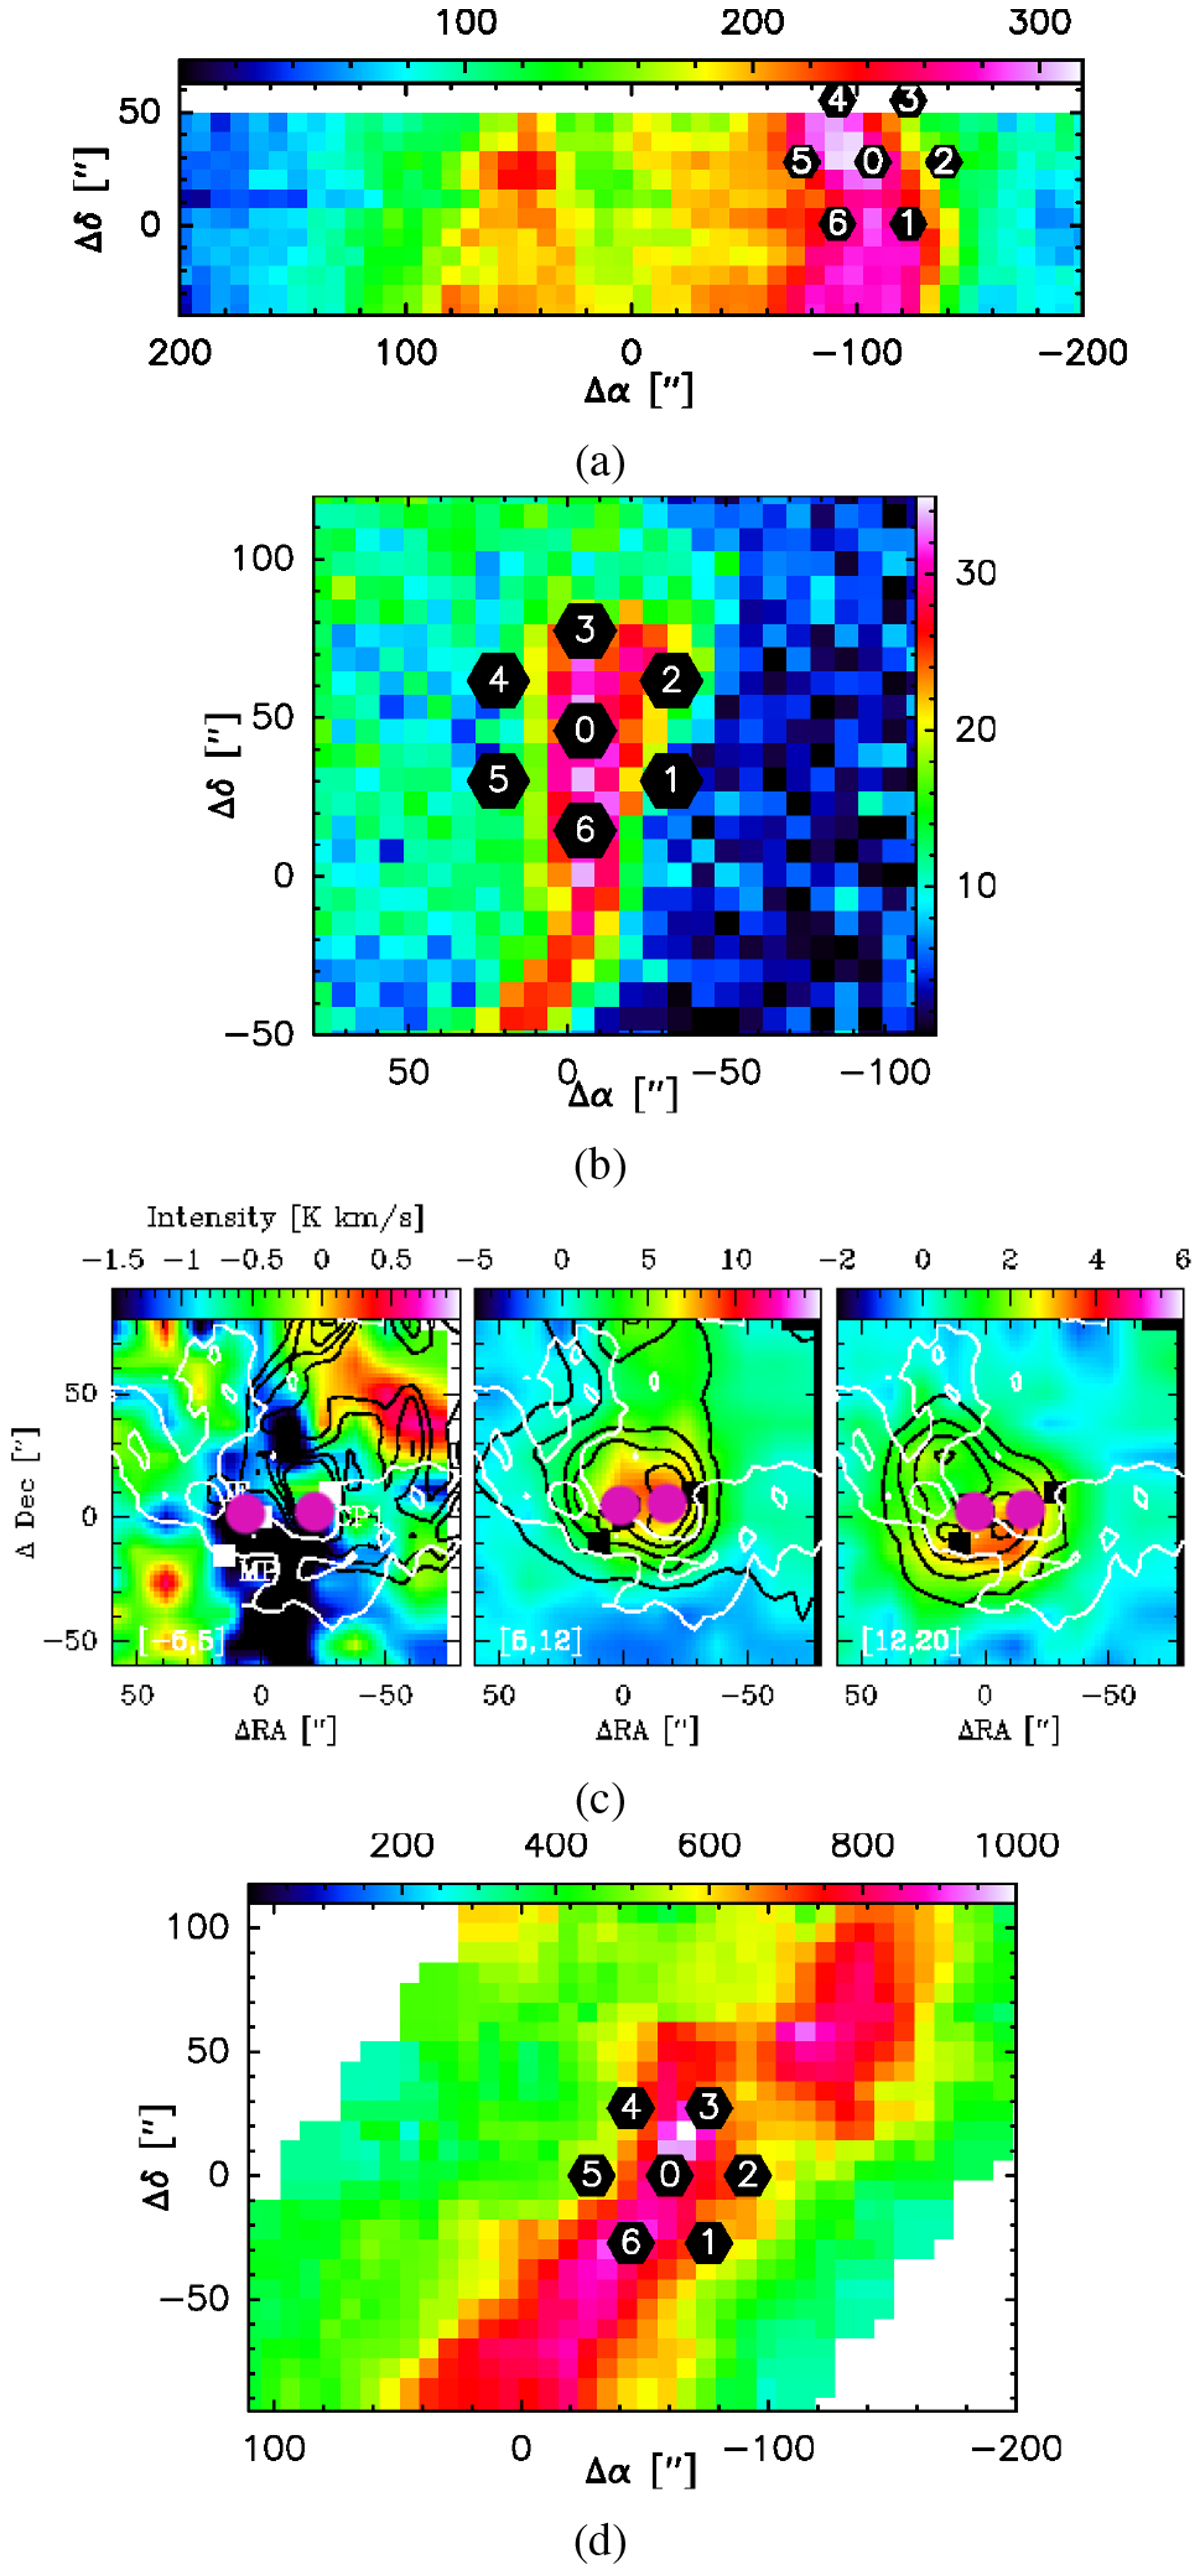
(a) M43 [C II] integrated intensity map between 5 and 15 km s−1 with theposition of the upGREAT array for the deep integration marked as black hexagons. (b) The Horsehead PDR [C II] integrated intensity map between 9 and 13 km s−1 with the position of the upGREAT array rotated at 30°. (c) Mon R2 [C II] integrated map intensity in black contours in overlay with other species, see Pilleri et al. (2014). We pointed the single L2 pixel of GREAT at the two positions marked by purple circles (the squares represent OH+ positions). (d) M17 SW [C II] integrated intensity map (Pérez-Beaupuits et al. 2012) between 15 and 25 km s−1 with the position of the upGREAT array at 0°.
Current usage metrics show cumulative count of Article Views (full-text article views including HTML views, PDF and ePub downloads, according to the available data) and Abstracts Views on Vision4Press platform.
Data correspond to usage on the plateform after 2015. The current usage metrics is available 48-96 hours after online publication and is updated daily on week days.
Initial download of the metrics may take a while.