Fig. 7
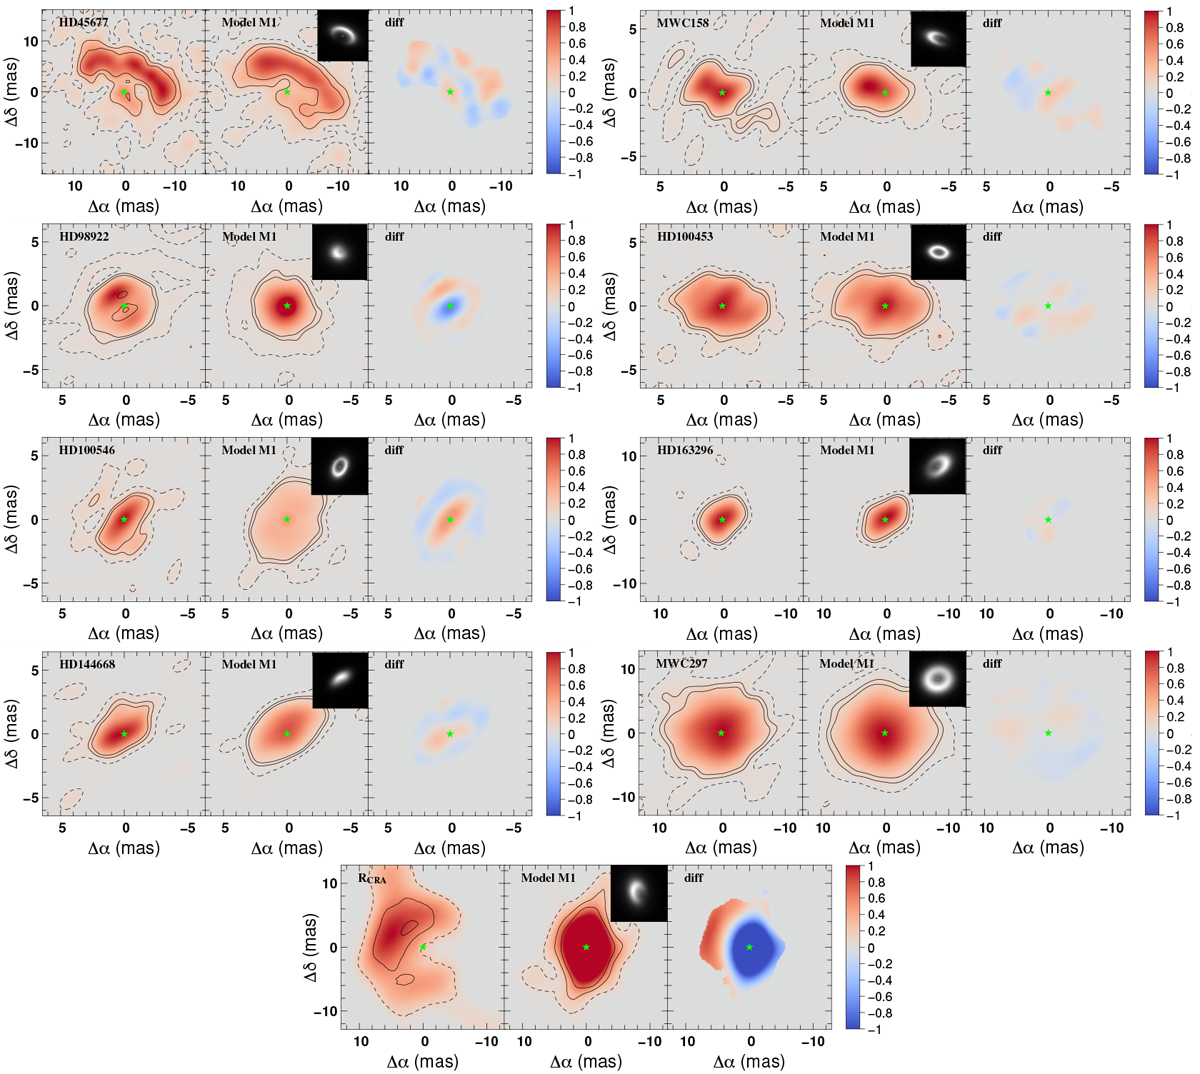
Comparison between the image reconstructions on each target from the dataset (left panels) and the synthetic data based on the best-fit m1 model from L17 (middle panels) and the difference (right panels) in the 3σ significance area of the image. In the top-right corner of the model image reconstruction, there is the high resolution image of theparametric model. The green star represents the position of the central star.
Current usage metrics show cumulative count of Article Views (full-text article views including HTML views, PDF and ePub downloads, according to the available data) and Abstracts Views on Vision4Press platform.
Data correspond to usage on the plateform after 2015. The current usage metrics is available 48-96 hours after online publication and is updated daily on week days.
Initial download of the metrics may take a while.