Free Access
Fig. F.3
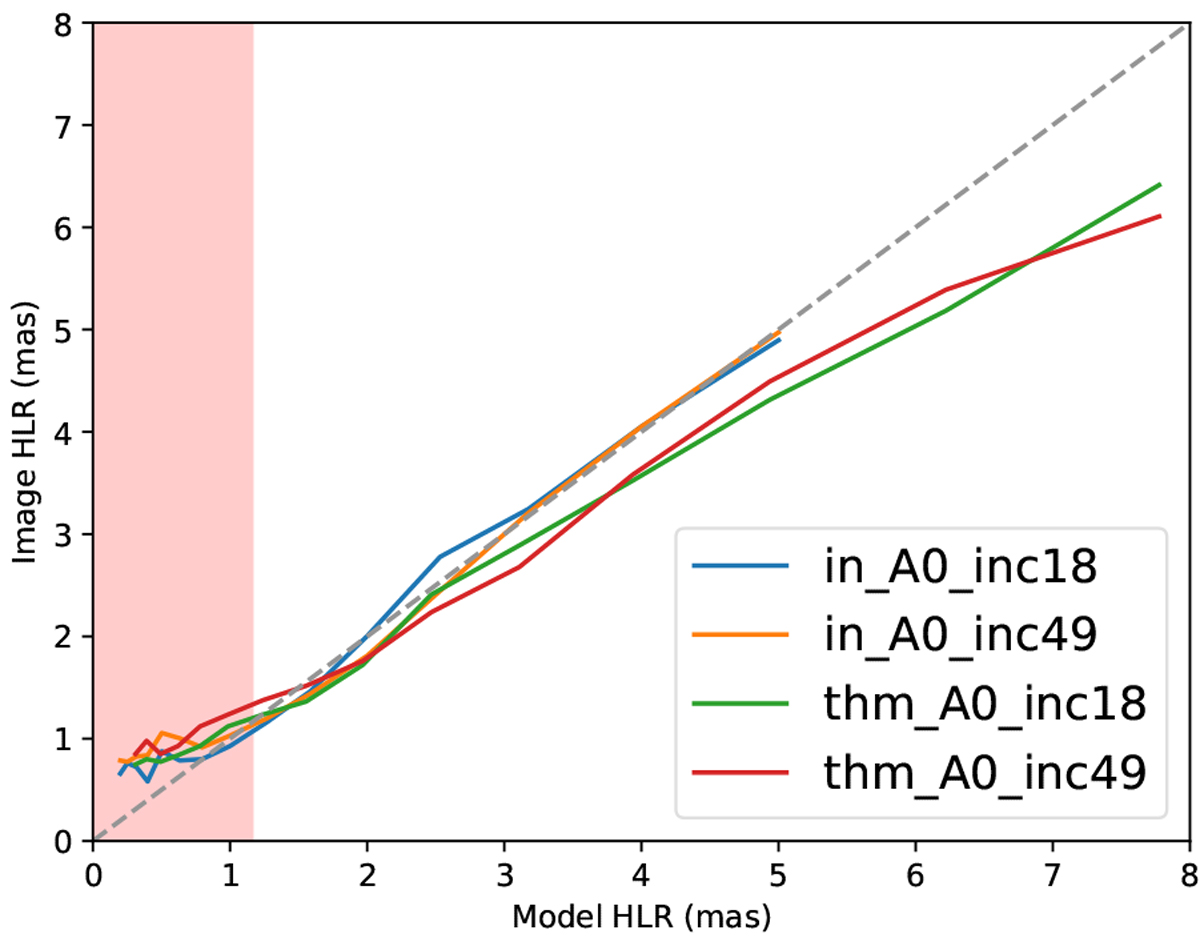
Comparison of the emission size measured in the image with the theoretical size. The red area indicates where the angular resolution given by the (u, v)-coverage is not sufficient in resolving the emission. The dashed line represents the 1:1 relation between the theoretical size and the size determined from the image.
Current usage metrics show cumulative count of Article Views (full-text article views including HTML views, PDF and ePub downloads, according to the available data) and Abstracts Views on Vision4Press platform.
Data correspond to usage on the plateform after 2015. The current usage metrics is available 48-96 hours after online publication and is updated daily on week days.
Initial download of the metrics may take a while.