Fig. 1.
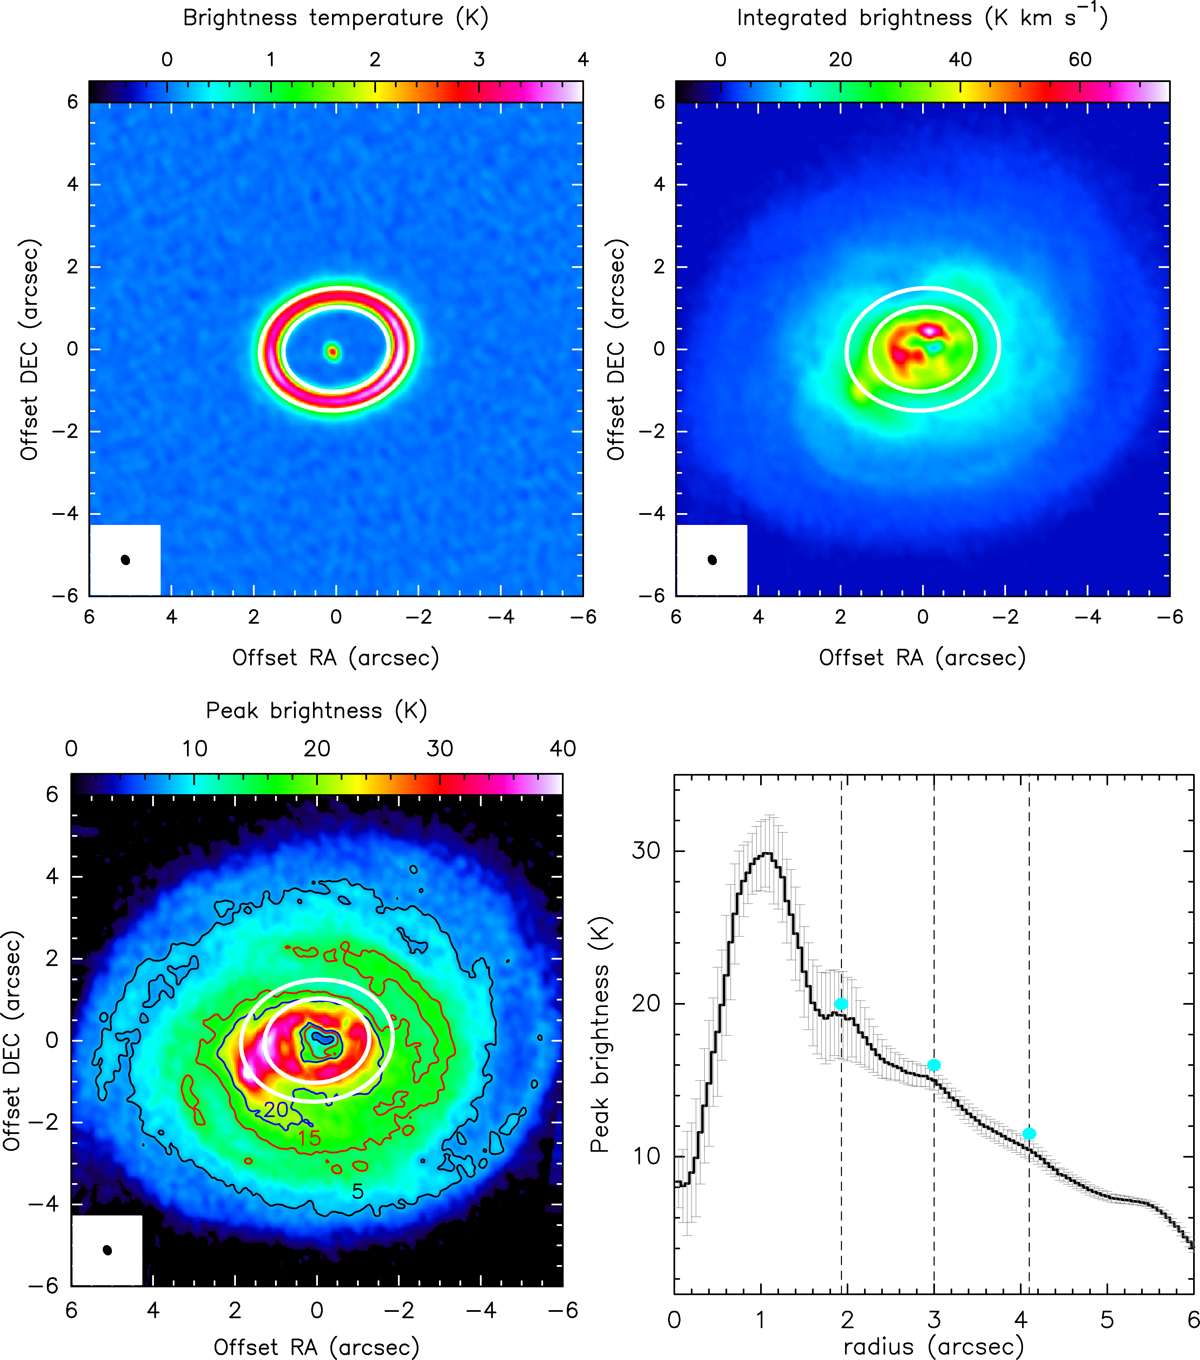
Upper panel: maps of the continuum brightness temperature (left) and integrated brightness of CO(2–1) (right). Lower panel: map of the peak brightness temperature of CO(2–1) (left) and its radial dependence on the plane of the disk (right). The white ellipses indicate the approximate inner and outer edge of the dust ring at 180 au and 260 au, respectively. The beam size is 0.31″ × 0.25″, and PA = 27° is shown in the lower left corners. Vertical lines mark the brightness at 1.9″, 3.0″ and 4.1″, respectively. The error bars indicate the azimuthal dispersion of the brightness (the high values near 1.8″ are due to the hot spot).
Current usage metrics show cumulative count of Article Views (full-text article views including HTML views, PDF and ePub downloads, according to the available data) and Abstracts Views on Vision4Press platform.
Data correspond to usage on the plateform after 2015. The current usage metrics is available 48-96 hours after online publication and is updated daily on week days.
Initial download of the metrics may take a while.