Open Access
Fig. 4.
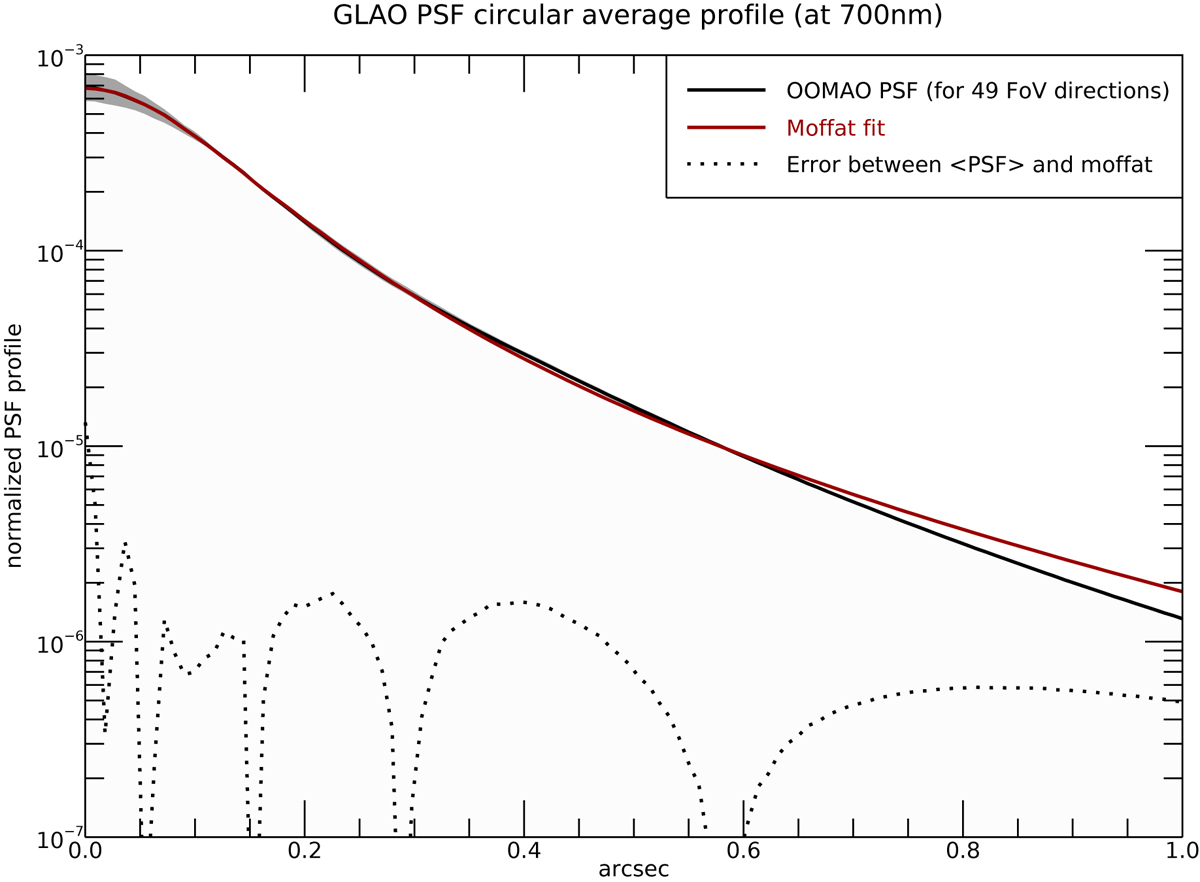
Comparison of a GLAO PSF profile computed in the MUSE WFM. The black dots show 49 regularly spaced positions in 1 × 1 arcmin2. The solid black line represents the average PSF for the 49 positions and the grey area shows the full dispersion of the PSF over the entire FoV. The red line shows the Moffat fit of the mean PSF.
Current usage metrics show cumulative count of Article Views (full-text article views including HTML views, PDF and ePub downloads, according to the available data) and Abstracts Views on Vision4Press platform.
Data correspond to usage on the plateform after 2015. The current usage metrics is available 48-96 hours after online publication and is updated daily on week days.
Initial download of the metrics may take a while.