Open Access
Fig. 2.
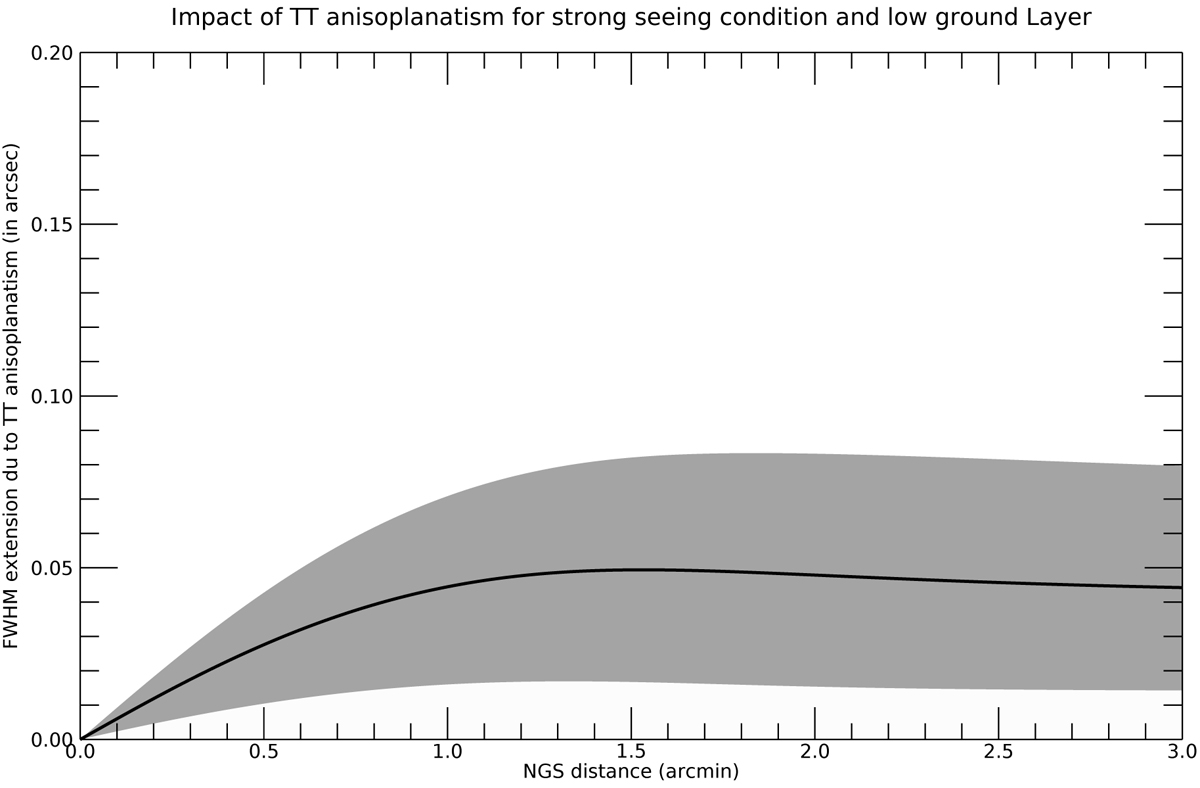
Tip tilt anisoplanatism for various atmospheric conditions obtained using data gathered on the MUSE RTC after one year of observations. The solid line corresponds to an average profile, and the grey area corresponds to the scattering of more than 400 data points gathered during more than one year by the GALACSI RTC.
Current usage metrics show cumulative count of Article Views (full-text article views including HTML views, PDF and ePub downloads, according to the available data) and Abstracts Views on Vision4Press platform.
Data correspond to usage on the plateform after 2015. The current usage metrics is available 48-96 hours after online publication and is updated daily on week days.
Initial download of the metrics may take a while.