Fig. 12.
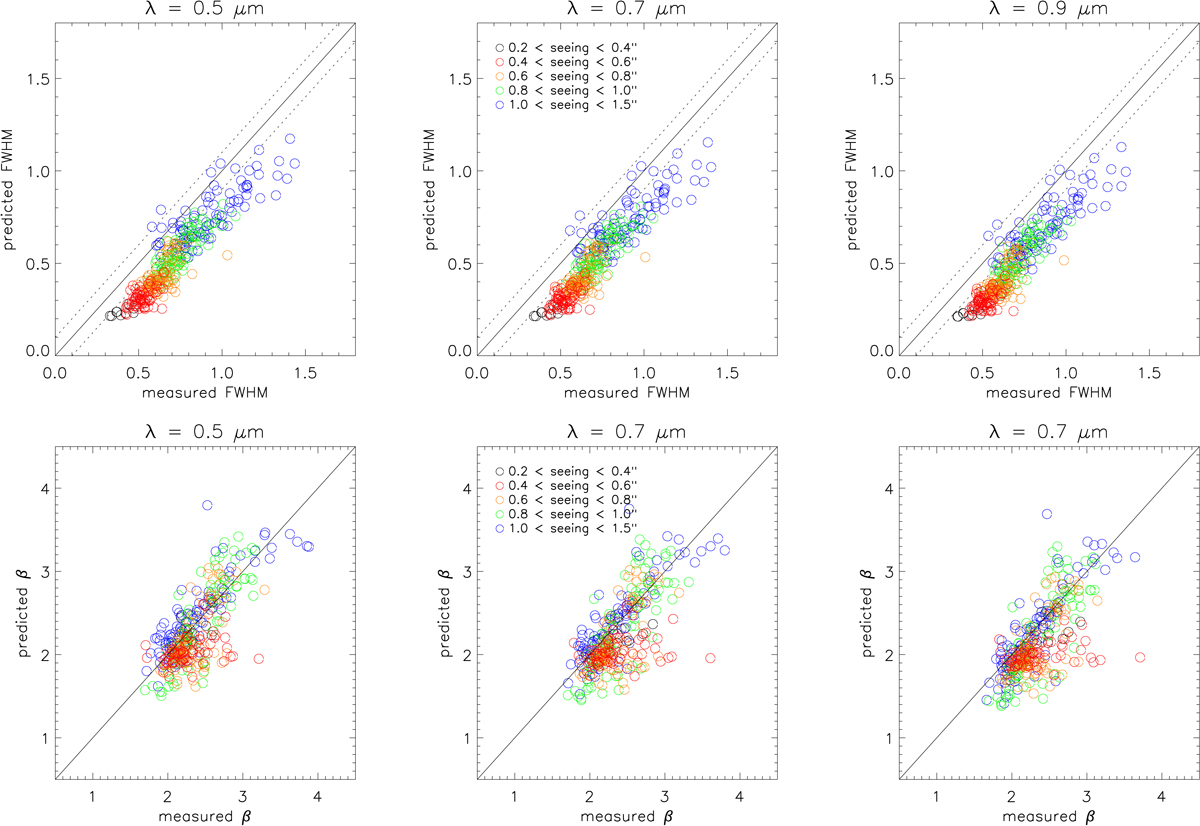
Comparison of FWHM (top) and β parameter (bottom) for measured data on MUSE images (extract from Globular Custer data) and PSFR data (computed from atmospheric data obtained using AO telemetry) convolved by a 0.2″ FWHM Gaussian function (to account for MUSE pixel size). The various colors stand for various seeing values domain (black: 0.2–0.4″ – red: 0.4–0.6″ – orange: 0.6–0.8″ – green: 0.8–1.0″ – blue: 1.0–1.5″
Current usage metrics show cumulative count of Article Views (full-text article views including HTML views, PDF and ePub downloads, according to the available data) and Abstracts Views on Vision4Press platform.
Data correspond to usage on the plateform after 2015. The current usage metrics is available 48-96 hours after online publication and is updated daily on week days.
Initial download of the metrics may take a while.