Fig. 4.
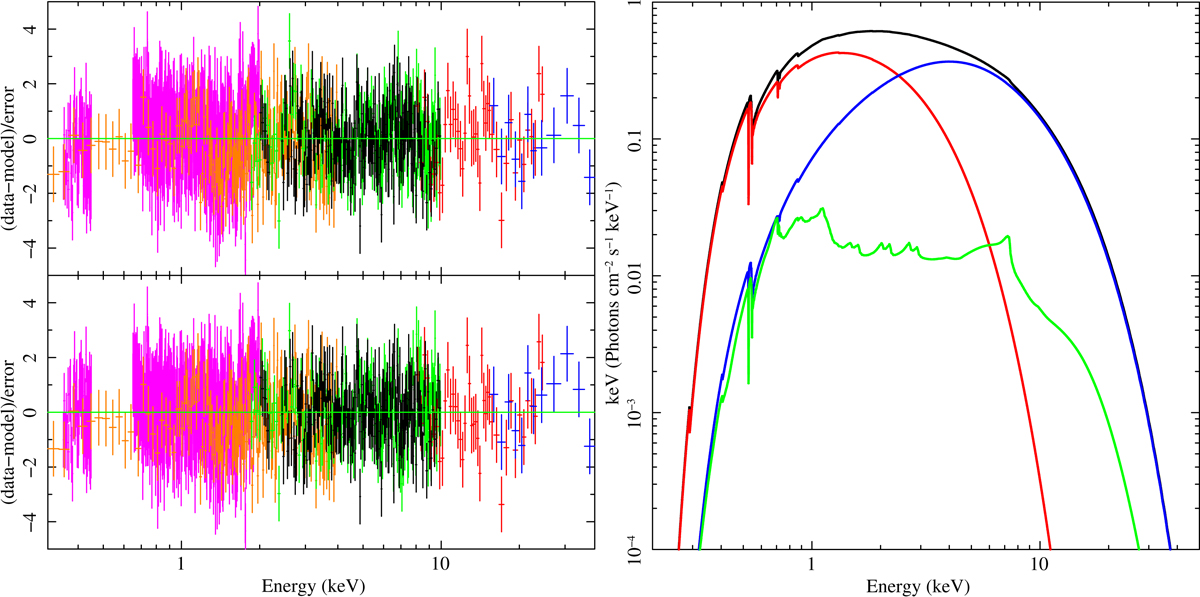
Left panel: residuals corresponding to Model 1 and Model 2 (top and bottom panel, respectively). The orange, magenta, black, green, red, and blue data are associated with the LECS, RGS12, Epic-pn, MECS23, HP, and PDS spectra, respectively. Right panel: unfolded spectrum corresponding to Model 2. The red, blue, and green curves represent DISKBB, NTHCOMP, and the reflection of the Comptonized component, respectively.
Current usage metrics show cumulative count of Article Views (full-text article views including HTML views, PDF and ePub downloads, according to the available data) and Abstracts Views on Vision4Press platform.
Data correspond to usage on the plateform after 2015. The current usage metrics is available 48-96 hours after online publication and is updated daily on week days.
Initial download of the metrics may take a while.