Free Access
Fig. 1.
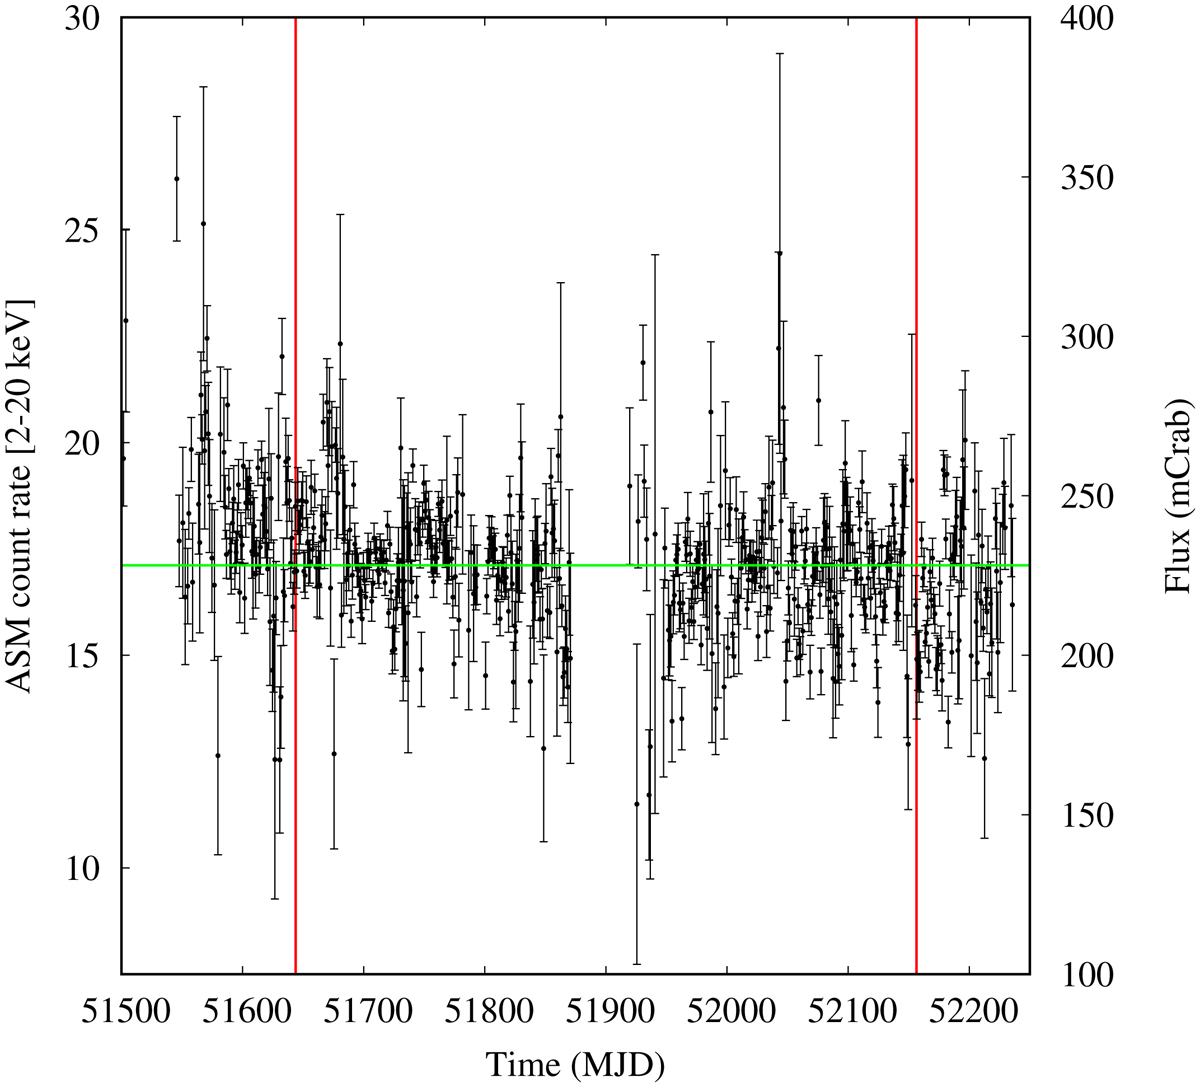
ASM light curve of GX 9+9 between 51 500 and 52 250 MJD. The bin time is one day. The two vertical red lines indicate the times of the BeppoSAX and XMM-Newton observations, respectively. The horizontal green line indicates the mean ASM count rate of 17.1 c s−1 (228 mCrab).
Current usage metrics show cumulative count of Article Views (full-text article views including HTML views, PDF and ePub downloads, according to the available data) and Abstracts Views on Vision4Press platform.
Data correspond to usage on the plateform after 2015. The current usage metrics is available 48-96 hours after online publication and is updated daily on week days.
Initial download of the metrics may take a while.